How the Accounts Receivable Turnover Ratio Drives Cash Flow
Master the accounts receivable turnover ratio to improve cash flow and operational efficiency. A practical guide for CFOs and Controllers.
The accounts receivable turnover ratio measures one thing: how efficiently your firm collects the money it's owed.
It’s a direct calculation of how many times you collect your average outstanding invoices in a specific period, like a quarter or a year.
Think of it as a KPI for your financial operations—a clean metric showing how effectively you convert services rendered into cash in the bank.
Why This Ratio Is a Critical Control for Your Firm
In professional services, revenue is tied to expertise, not inventory. This makes the speed of cash conversion paramount to operational stability and growth.
The AR turnover ratio is a leading indicator of financial health.
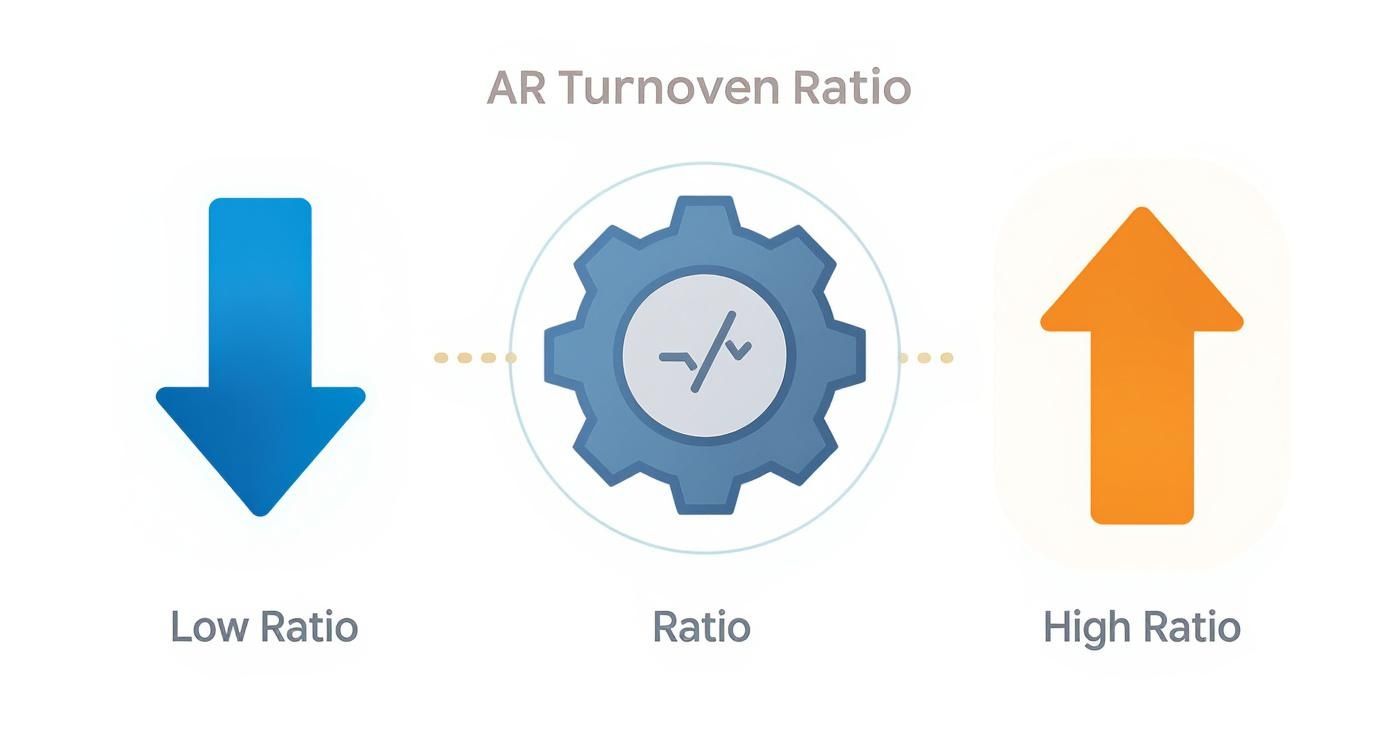
A high ratio signifies efficient credit and collections processes, leading to predictable cash flow. A low ratio is a warning light. It indicates that capital is trapped in unpaid invoices, a drag on liquidity that can destabilize the firm.

From Metric to Management Tool
For a CFO or Controller, the ratio's value isn't the number itself, but the operational questions it surfaces. A declining ratio is a diagnostic tool pointing to friction in your revenue cycle.
It prompts critical analysis:
- Are our invoice terms clear and enforceable?
- Is our client credit vetting process sufficiently rigorous?
- Does our collections process follow a system, or is it purely reactive?
Answering these questions transforms a passive metric into an active lever for financial control. It exposes operational weaknesses before they escalate into material costs. Those costs are real; explore the true cost of AR inefficiency in professional services to quantify the impact.
The Impact on Liquidity and Control
A strong AR turnover ratio provides control over the firm’s capital. When collections are efficient, you have the cash to manage operating expenses, invest in talent, and navigate economic shifts without relying on a line of credit.
A consistently low turnover ratio means your firm is extending interest-free loans to its clients. You are allowing them to use your working capital for their operational benefit.
By monitoring this metric, finance leaders can shift from reacting to cash flow shortages to proactively managing liquidity. It ensures the value your firm creates is realized as cash, solidifying its financial foundation.
How to Calculate the AR Turnover Ratio Correctly
Inaccurate metrics produce flawed strategy. A precise accounts receivable turnover ratio provides an objective measure of your firm's efficiency in converting receivables to cash. A miscalculation is worse than no data at all—it creates a blind spot where operational problems can fester.
The formula is standard, pulling two key figures from your financial statements:
AR Turnover Ratio = Net Credit Sales / Average Accounts Receivable
The integrity of the output depends entirely on the precision of the inputs. Let's define each component for a professional services context.
Defining the Formula Inputs
To achieve a clean result, you must use clean data. Isolate the exact figures that reflect your client billing and collections cycle.
- Net Credit Sales: This is not total revenue. It is the revenue generated from services provided on credit, less any returns, allowances, or bad debt write-offs. For most service firms, this figure constitutes the vast majority of revenue. It is located on the income statement.
- Average Accounts Receivable: This is a time-weighted average that smooths out monthly fluctuations. It prevents a single period of high or low collections from distorting the annual picture. Calculate it by adding the beginning and ending AR balances for the period and dividing by two. Both balances are found on the balance sheet.
A Practical Example for a Services Firm
Consider a $10 million professional services firm analyzing its fiscal year performance. The Controller would pull data from their accounting system, which may use QuickBooks AR automation.
Here is a standard calculation table.
Sample Calculation for a $10M Services Firm
Metric | Formula / Source | Example Value |
|---|---|---|
Beginning AR Balance | Prior Year Balance Sheet | $1,200,000 |
Ending AR Balance | Current Year Balance Sheet | $1,300,000 |
Average Accounts Receivable | (Beginning AR + Ending AR) / 2 | $1,250,000 |
Total Revenue | Current Year Income Statement | $10,250,000 |
Returns & Allowances | Current Year Income Statement | ($250,000) |
Net Credit Sales | Total Revenue - Returns & Allowances | $10,000,000 |
AR Turnover Ratio | Net Credit Sales / Average AR | 8.0 |
What does the resulting 8.0 signify?
It means the firm collected its entire average accounts receivable balance 8 times during the year. This KPI provides a benchmark for collections effectiveness and its direct impact on improving cash flow. For additional examples, see these AR turnover calculations on corporatefinanceinstitute.com.
Standardizing this calculation as part of your financial review creates a reliable KPI for tracking performance over time.
Interpreting Your AR Turnover Ratio
You have calculated your accounts receivable turnover ratio. The number itself is meaningless without context.
Its value comes from comparison—against prior periods, internal targets, and industry benchmarks. A ratio that is strong for a marketing agency could be a warning sign for a law firm with different billing cycles.
The goal is to understand the story the data is telling about your firm’s operational efficiency.
What Is a “Good” Accounts Receivable Turnover Ratio?
For professional services, there is no single "good" number. Performance is relative. A firm managing long-term enterprise contracts operates on a different payment cycle than one handling high-volume, short-duration projects.
Establish your own baseline and monitor the trend.
A consistently high ratio, such as 10-12, generally indicates efficient operations. Invoices are accurate, terms are clear, and clients pay on time. However, an exceptionally high ratio could signal overly restrictive credit policies that may be turning away qualified clients.
A low ratio—below 6, for example—is a direct signal of operational drag. It indicates that cash is trapped in receivables. The causes are often multifaceted: slow-paying clients, inefficient invoicing, or billing disputes that halt payments.
Your accounts receivable turnover ratio is a diagnostic tool. A downward trend is an early warning system, enabling you to address process flaws before they become a cash flow crisis.
Benchmarking Against Industry Norms
To fully contextualize your performance, you must look externally.
Different industries operate at different velocities. Retail, for instance, often sees an average turnover around 9 times per year. Manufacturing firms are typically closer to 6 to 8 times annually due to longer credit terms in their supply chains. You can find more industry benchmarks over at maxio.com.
For professional services, benchmarks must be specific. A law firm's payment cycle is structurally different from an engineering firm's. Comparing against the correct peer group is essential for an accurate assessment.
This analysis provides clarity. It helps determine if a low ratio is a firm-specific problem or an industry-wide condition.
Ultimately, interpreting your AR turnover ratio is about converting data into an action plan. Whether you use QuickBooks AR automation or other AR software for professional services, the objective is the same: track, benchmark, and question this metric to reduce DSO and improve cash flow with precision.
Connecting Turnover Ratio, DSO, and Cash Flow
The accounts receivable turnover ratio provides a high-level view of collections efficiency. For day-to-day operational management, a more granular metric is required.
This is the function of Days Sales Outstanding (DSO).
If turnover measures how often you collect, DSO measures how long it takes. They are inverse measures of the same process. The turnover ratio is the annual scorecard; DSO is the average number of days to convert a receivable into cash.
The formula is direct:
DSO = 365 / Accounts Receivable Turnover Ratio
Using our previous example, a firm with an AR turnover ratio of 8.0 has a DSO of 45.6 days (365 / 8). The abstract ratio is now a concrete operational metric. It takes this firm, on average, just over 45 days to get paid.
This diagram illustrates the relationship.
A higher turnover ratio is the objective, as it directly reduces DSO—a clear indicator of a healthy and efficient collections process.
From Lower DSO to Improved Cash Flow
The purpose of improving turnover and reducing DSO is to increase working capital. Each day removed from the DSO cycle unlocks cash that was previously tied up on the balance sheet. This directly improves the firm's liquidity and strategic flexibility.
Consider a firm with $10 million in annual credit sales.
- Scenario A (DSO of 60 days): This firm has approximately $1,643,835 in outstanding receivables at any given time ($10M / 365 * 60).
- Scenario B (DSO of 45 days): After process improvements, the DSO is reduced. The firm now has $1,232,876 in receivables ($10M / 365 * 45).
This 15-day improvement in DSO freed up over $410,000 in cash. That is capital available for payroll, investment, or growth—without increasing debt. The link between AR process efficiency and a strong cash position is direct and measurable.
How This Appears on Financial Statements
A company’s cash flow statement reveals its true operational health. High DSO suppresses cash from operations, even when the firm is profitable on paper.
Understanding this dynamic is fundamental to accurate financial forecasting. These example cash flow statement templates illustrate the connection.
Ultimately, a high accounts receivable turnover ratio drives low DSO, which in turn fuels stronger, more predictable cash flow. For a finance leader, optimizing this chain is a core responsibility. Accounts receivable automation can systematically reduce collection times and unlock capital. For more on this, see our guide on ways to increase cash flow.
Actionable Strategies to Improve Your AR Turnover Ratio
Knowing your AR turnover ratio is diagnosis. The real work is implementing operational changes that accelerate collections and improve predictability. For finance leaders, this is about building a system that tightens financial controls and strengthens cash flow.
Effective strategies fall into two categories: refining foundational policies and implementing technology. Both are required for meaningful, sustained improvement.
Refine Foundational Policies
Automation cannot fix a broken process. Your underlying policies must be clear and consistently enforced. Ambiguity invites payment delays.
Start with these fundamentals:
- Establish Clear Credit Policies: Not all revenue is good revenue. Implement a standardized, data-driven process for assessing client creditworthiness before engagement. This is not about being difficult; it is about managing risk from the outset.
- Standardize Invoice Terms: Eliminate vague language. If terms are Net 30, the contract must specify this means payment is due within 30 calendar days of the invoice date. Ambiguity creates friction.
- Implement Proactive Communication: Do not wait for an invoice to become delinquent. A professional reminder sent several days before the due date prevents a significant percentage of late payments. It demonstrates organization and keeps your invoice visible.
To materially improve your AR turnover ratio, you must manage how you get paid, not just what you are owed. This requires timely, accurate billing and finding ways to simplify your invoicing and payment processes.
Embrace Technology with Accounts Receivable Automation
Manual AR processes are inherently inconsistent and prone to error—both of which depress your turnover ratio. Accounts receivable automation introduces the discipline required to accelerate collections without alienating clients.
The accounts receivable turnover ratio isn’t just an internal metric; it's a signal to lenders and investors. A ratio of 10 tells them you collect your receivables every 36 days on average—a sign of strong liquidity and low credit risk. That can open the door to better borrowing terms.
AI-powered AR automation provides a systematic framework for managing the entire invoice-to-cash cycle. This technology does not replace your team; it equips them with better tools, automating repetitive tasks so they can focus on complex issues that require human intervention.
Key Levers of AR Automation
AR software for professional services targets the specific friction points that cause payment delays. For firms using common accounting platforms, QuickBooks AR automation can integrate seamlessly, providing immediate control over the collections process.
This looks like:
- Systematized Invoice Delivery: Automation ensures every invoice is generated correctly and delivered instantly via the client’s preferred channel. The "we never received it" excuse is eliminated.
- Intelligent Payment Reminders: AI-driven systems adjust the timing, frequency, and tone of reminders based on client payment history and invoice age. A reliable client receives a gentle nudge; a chronically late payer receives a more direct follow-up.
- Automated Escalation Workflows: Define the rules for escalating an overdue invoice. For example, at 45 days past due, the system can automatically notify the account manager or flag the account for a call from the finance team. It is your collections policy, executed flawlessly.
These levers directly address the friction that lowers your AR turnover ratio. By automating routine work, you reduce DSO, improve cash flow, and free your finance team for more strategic analysis. The result is a collections process that is both efficient and professional.
Using AR Automation to Drive Efficiency
Process optimization is necessary, but manual workflows have a performance ceiling. Even the most disciplined finance team faces limitations. There is a cap on how much the accounts receivable turnover ratio can be improved through manual effort alone.
Technology provides a distinct operational advantage.
Accounts receivable automation directly addresses the root causes of collection delays: inconsistency, human error, and lack of real-time visibility. It augments your team, freeing them from repetitive tasks to focus on high-value client relationships and complex resolutions.

From Manual Effort to Systematic Execution
The core function of accounts receivable automation is to enforce consistency. Every invoice is delivered on time. Every reminder is sent at the correct interval. Every escalation follows firm protocol, without exception.
This systematic approach directly improves key financial metrics. Systems designed for QuickBooks AR automation sync with your general ledger, closing the operational gaps between invoicing and payment. The result is a collections process that is predictable and accelerated.
Automation transforms accounts receivable from a reactive, manual chore into a proactive, data-driven system. This shift directly leads to a higher turnover ratio, a lower DSO, and ultimately, a stronger cash position for the firm.
This level of control allows finance leaders to manage cash flow with precision, rather than reacting to payment delays.
Key Features of AI AR Automation
Modern AR software for professional services is more than an email scheduler. AI AR automation adds an intelligent layer that adapts to client behavior and internal policies, ensuring the right action is taken at the right time.
Key capabilities include:
- Automated Invoice Distribution: Invoices are delivered instantly via the client's preferred channel—email, SMS, or a dedicated portal. This eliminates a primary source of payment delays.
- Customized Reminder Schedules: The system can tailor the timing and tone of follow-ups based on client payment history, invoice size, or contract terms. A low-risk client receives a different cadence than a high-risk one.
- Centralized Dashboards: Controllers and CFOs gain real-time visibility into AR aging, outstanding balances, and team performance in one location. This data allows for the early identification of bottlenecks and at-risk accounts.
These features reduce the manual workload on your finance team, minimize errors, and accelerate collections. Each outcome directly contributes to an improved cash flow and a healthier AR turnover ratio. For a deeper analysis, see our complete guide to accounts receivable automation software.
Answering Key Questions from Finance Leaders
A firm grasp of the accounts receivable turnover ratio separates financial guesswork from genuine operational control. Here are common questions from CFOs and Controllers in professional services.
What is a good AR turnover ratio for a professional services firm?
There is no universal benchmark, as it depends on your client base and service type. However, a ratio between 8 and 12 generally indicates a healthy process, corresponding to a collection cycle of 30 to 45 days.
A ratio below 6 signals a potential drag on working capital. Conversely, a ratio significantly above 12 could indicate overly restrictive credit terms that may be limiting growth.
The most effective approach is to benchmark against your firm’s historical performance and that of direct industry peers.
How often should this ratio be calculated?
For strategic oversight, calculate the AR turnover ratio quarterly and annually. This provides a clear view of trends and smooths out monthly volatility.
For tactical control, your finance team should monitor underlying data, such as AR aging reports, on a weekly basis. This enables early identification of slow-paying clients before they negatively impact a full quarter's results. AR software for professional services provides this real-time visibility.
How does QuickBooks AR automation improve this ratio?
It addresses the root causes of a low turnover ratio: manual friction, inconsistent follow-ups, delayed invoicing, and human error. QuickBooks AR automation tools systematize the collections workflow.
The specific impacts are:
- Timely Invoicing: Invoices are sent automatically upon completion of project milestones, starting the payment clock immediately.
- Consistent Follow-up: Automated, professional reminders are sent on a pre-defined schedule. Nothing is forgotten.
- Centralized Visibility: A dashboard provides an instant overview of all outstanding receivables, allowing your team to focus on accounts requiring direct intervention.
By enforcing a consistent and disciplined process, automation accelerates collections. The direct outcomes are a higher turnover ratio and a lower DSO.
This system elevates accounts receivable from a reactive, administrative function to a predictable, strategic component of the firm's financial operations.
--- Resolut automates AR for professional services—consistent, accurate, and human.