What is the Accounts Receivable Turnover Ratio? A Guide for Financial Operators
Discover what is accounts receivable turnover ratio and why it matters for cash flow. Learn how to calculate it and how to improve it.
The accounts receivable turnover ratio is a direct measure of your firm's operational efficiency. It quantifies how effectively you convert billable work into cash.
For financial operators, this metric is about control. It reveals how many times per period—typically a year—your firm collects its average outstanding receivables. A higher ratio indicates a disciplined collections process and healthy cash flow.
A lower ratio is a leading indicator of risk, pointing to potential issues in your collections process, overly permissive credit terms, or deteriorating client financial health.
Understanding the Accounts Receivable Turnover Ratio

For a professional services firm, this ratio is the RPM gauge for your cash engine. It measures the velocity at which invoices become cash in the bank.
A high turnover ratio signals efficient collections, sound credit policies, and a high-quality client base. Conversely, a low or declining ratio is an early warning. It signals a need to investigate your process, credit terms, or client stability.
The Core Metric Defined
The accounts receivable turnover ratio quantifies how many times a company collects its average accounts receivable during a defined period. The calculation is net credit sales divided by average accounts receivable.
For example, a firm with $4,800,000 in net credit sales and an average A/R balance of $600,000 has a turnover ratio of 8.0. This means the firm collected its average receivables eight times during the year.
This metric provides a hard data point for financial decision-making, moving beyond subjective assessments of cash flow.
A/R Turnover Ratio Components
Component | Definition | Significance for Operators |
|---|---|---|
Net Credit Sales | Total revenue from services billed on credit, minus returns and write-offs. | The value you are contractually owed and must convert to cash. |
Average A/R | The average of beginning and ending A/R balances for the period. | A stable baseline that smooths fluctuations for an accurate efficiency measure. |
Turnover Ratio | Net Credit Sales ÷ Average A/R. | The primary measure of collections velocity and effectiveness. |
This ratio provides a quantitative view of your firm's liquidity and collections control.
A change in the ratio is a signal to investigate. Is a process improvement driving a positive trend, or is a new risk emerging? Your role is to interpret the data and act.
This ratio is a foundational element. Understanding its place alongside understanding other crucial financial ratios provides a comprehensive view of business health. Consistent monitoring enables predictable financial performance.
How to Calculate the A/R Turnover Ratio

Calculating this ratio requires precision. Inaccurate inputs yield misleading outputs, creating either a false sense of security or unnecessary alarm.
The formula is the foundation for understanding how efficiently your firm converts billings into cash.
The core formula is:
A/R Turnover Ratio = Net Credit Sales ÷ Average Accounts Receivable
This calculation reveals how many times the firm collected its average outstanding receivables over a specific period. Let's deconstruct each component for accuracy.
Isolate Net Credit Sales
For a professional services firm, Net Credit Sales is the revenue billed on credit, adjusted for any reductions. It is the real value you expect to collect.
To calculate it, start with total gross billings for the period, then subtract:
- Credits Issued: Reductions for scope changes or service adjustments.
- Allowances: Reversals of any previously billed charges.
- Bad Debt Write-offs: Invoices officially deemed uncollectible.
This calculation provides the true numerator. Using gross billings would inflate the ratio and obscure underlying collection issues.
Calculate Average Accounts Receivable
The denominator, Average Accounts Receivable, smooths out variances caused by seasonal work or large projects. A single day's A/R balance is not representative.
The formula is:
(Beginning A/R Balance + Ending A/R Balance) ÷ 2
These figures are taken from the balance sheets at the start and end of the chosen period (e.g., January 1st and December 31st). This average provides a stable baseline of receivables carried throughout the period.
A Practical Example: $10M Consulting Firm
Let's apply this to a hypothetical $10M consulting firm.
Data:
- Gross Billings (Annual): $10,000,000
- Credits & Write-offs: $200,000
- Beginning A/R (Jan 1): $1,200,000
- Ending A/R (Dec 31): $1,400,000
Calculation Steps:
- Calculate Net Credit Sales:
- $10,000,000 (Gross Billings) - $200,000 (Credits) = $9,800,000
- Calculate Average Accounts Receivable:
- ($1,200,000 + $1,400,000) ÷ 2 = $1,300,000
- Calculate the A/R Turnover Ratio:
- $9,800,000 (Net Credit Sales) ÷ $1,300,000 (Average A/R) = 7.54
The firm's A/R turnover ratio is 7.54. It collected its average receivables approximately 7.5 times during the year. This number is the starting point for a deeper analysis to reduce DSO and improve cash flow.
Interpreting the A/R Turnover Ratio
An A/R turnover ratio of 7.54 is a data point. Its value comes from context—tracking it over time and comparing it against relevant benchmarks.
A high ratio indicates a strong financial pulse. Cash circulates through the business efficiently, suggesting effective collections and disciplined credit policies.
A low or falling ratio is an early warning. It may signal an inconsistent collections process, overly generous payment terms, or a client's financial instability.
High vs. Low Ratio: What They Signal
A single number can reveal much about your firm’s financial discipline.
- High Ratio (e.g., 9 or 10): Indicates strong performance. The firm collects payments effectively, which means less cash is tied up in receivables. This directly improves cash flow and lowers bad debt risk.
- Low Ratio (e.g., 4 or 5): A clear indicator of inefficiency. Cash collection is slow, straining working capital. It signals that credit policies or collections processes require immediate review.
The objective is a stable and predictable ratio. A sudden spike might mean credit terms are too restrictive, potentially turning away qualified clients. A steady decline, however, demands immediate investigation.
* **Visual Idea 1: A clean dashboard showing a single gauge needle pointing to a healthy A/R turnover ratio (e.g., 8.5) in a green zone, contrasted with a lower number in a red zone. The background is a minimalist, professional office setting. ***
Establishing the Right Benchmark
A "good" ratio is relative. A/R turnover varies significantly by industry. A retailer might have a ratio above 12, while a construction firm could be near 4 due to long project billing cycles. More examples of how turnover ratios differ across sectors on Upflow.io can provide context.
For a professional services firm, only these benchmarks matter:
- Historical Performance: Is your ratio improving, declining, or flat? This trend is your primary indicator of process effectiveness.
- Industry Peers: Data for consulting, legal, or architectural firms is relevant. A common benchmark for professional services is between 6 and 8.
- Financial Targets: If the goal is to reduce DSO, a target turnover ratio can be established to drive operational changes.
This approach transforms a passive metric into an active diagnostic tool, identifying where your collections engine needs optimization.
* **Visual Idea 2: A simple line chart titled "A/R Turnover Ratio: Trend vs. Benchmark." The x-axis shows quarters (Q1, Q2, Q3, Q4), and the y-axis shows the ratio value. One solid line shows "Our Firm" trending steadily upward from 7.2 to 8.1. A dotted line labeled "Industry Benchmark" remains flat at 7.5. ***
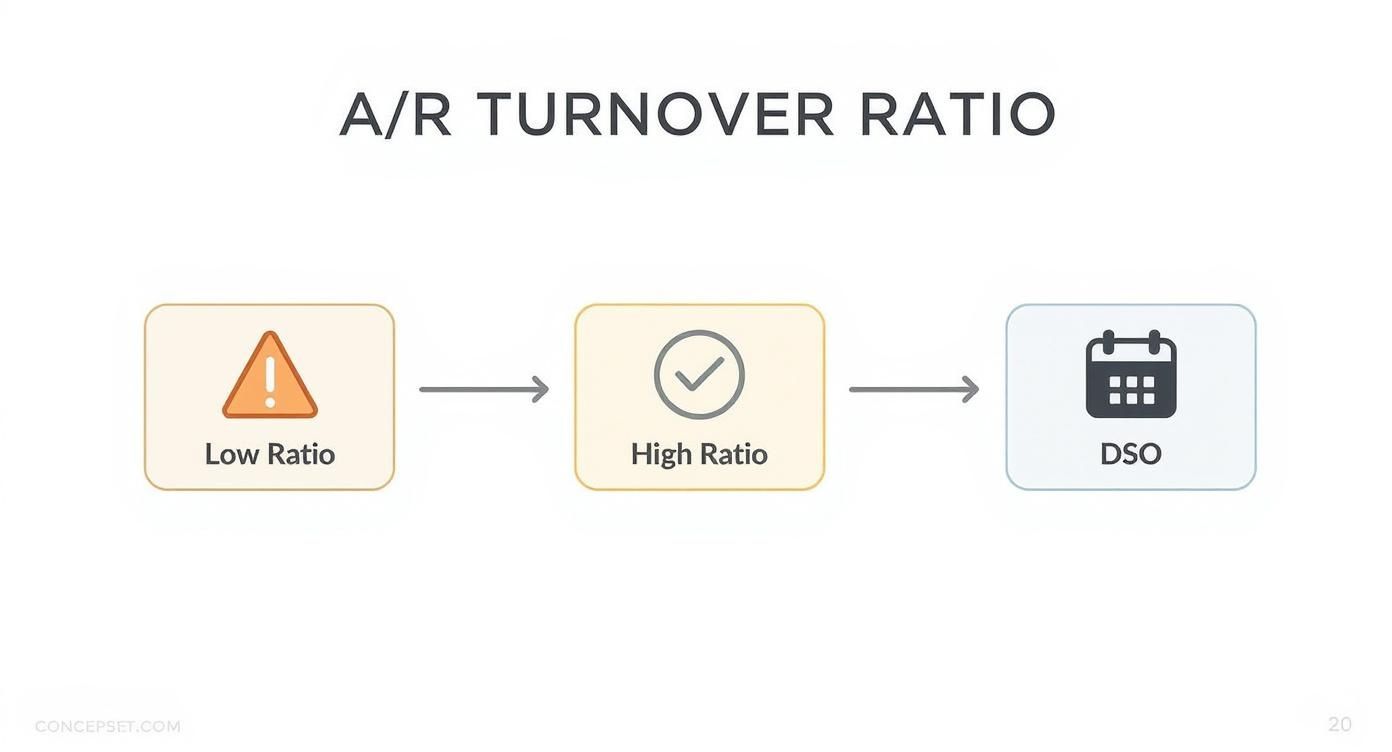
Connecting A/R Turnover to DSO and Cash Flow
Your accounts receivable turnover ratio is directly and inversely related to Days Sales Outstanding (DSO).
Turnover measures collection frequency, while DSO measures collection duration. A high turnover ratio is valuable because it directly reduces your DSO. When you reduce DSO, you convert revenue into usable cash more quickly.
The Direct Link Between Turnover and DSO
The formula connecting these two metrics is simple. DSO shows the average number of days it takes to collect payment after an invoice is issued.
DSO = 365 / Accounts Receivable Turnover Ratio
This formula translates an efficiency score into a tangible timeline. Improving your collections is a direct lever for increasing working capital.
Using our previous example of the $10M firm with a turnover ratio of 7.54, the DSO is:
- DSO = 365 / 7.54 = 48.4 days
On average, the firm waits 48 days to get paid. The immediate operational question is: how do we reduce this?
This visual demonstrates the cause-and-effect relationship.
A higher turnover ratio is the engine that pulls cash from your aging report into your bank account, which is critical to improve cash flow.
The Financial Impact of Reducing DSO
Reducing DSO is one of the most effective ways to unlock cash without debt or dilution. Let's model a realistic improvement for our example firm.
By implementing systematic follow-ups and clearer invoicing, the firm increases its A/R turnover ratio from 7.54 to 9.0.
The immediate impact on cash flow:
- New DSO = 365 / 9.0 = 40.6 days
- DSO Reduction = 48.4 days - 40.6 days = 7.8 days
Shaving nearly eight days from the collection cycle on $9.8M of credit sales frees up over $214,000 in working capital ($9.8M / 365 days * 7.8 days).
This is cash that was previously trapped on the balance sheet, now available for payroll, investment, or operations. This is central to the cash conversion cycle. A healthy A/R turnover is the cornerstone of a fast, efficient cycle.
For a deeper analysis, see our guide on optimizing the entire order-to-cash process for financial operators.
How to Improve Your A/R Turnover Ratio

Improving A/R turnover is not about aggressive collection tactics. It is about building a system that prevents late payments.
For a professional services firm, this requires replacing reactive, manual efforts with a proactive, structured process for credit, invoicing, and follow-up.
Establish Stronger Credit Policies
The most effective way to improve collections is to avoid extending credit to clients with a history of late payments. A vague credit policy invites friction.
Your credit policy should be a documented framework for risk management.
A robust policy includes:
- Standard Payment Terms: Define default terms (e.g., Net 30) and clarify exceptions.
- Client Onboarding Checks: Conduct credit checks for significant new engagements.
- Defined Credit Limits: Set a maximum outstanding balance for each client.
This initial control is your first defense against a declining turnover ratio.
A disciplined credit policy ensures you are not inadvertently financing your clients' operations. It shifts the dynamic from hoping for timely payment to expecting it.
Design Invoices for Action
An invoice is a call to action. If it is confusing, incorrect, or delayed, it will be ignored. Every day an invoice remains unsent directly hurts your turnover ratio.
The objective is absolute clarity and speed. Your invoices must be easily processed by a client's AP department.
Implement these immediate fixes:
- Itemize with Detail: Clearly list services performed, tying them to the scope of work.
- Make the Due Date Prominent: Use bold text and place it at the top of the invoice.
- Offer Multiple Payment Options: Provide clear instructions for ACH, wire, and credit card payments, including a direct payment link.
Small points of friction create significant delays. You can find more practical tips in our guide covering eight real-world ways to clean up your accounts receivable.
Systematize Collections Follow-Up
Your collections process must be predictable, professional, and consistent. Relying on manual reminders is inefficient and prone to human error. A systemized cadence ensures no invoice is overlooked.
A structured follow-up sequence could include:
- Invoice Delivery Confirmation: An automated email confirms receipt.
- Pre-Due Date Reminder: A polite reminder sent 3-5 days before payment is due.
- Day 1 Overdue Notice: A professional email sent the day after the due date.
- Structured Escalation: A defined plan for 15, 30, and 45 days past due.
This is where accounts receivable automation provides a distinct advantage. The right AR software for professional services can execute this cadence flawlessly, driving discipline and improving cash flow.
Using Automation for Control and Predictability
Systematizing collections is effective, but manual processes have inherent limitations in terms of scale, consistency, and human error.
At a certain volume, manual effort becomes a bottleneck. This is the point where technology must be introduced to achieve the next level of operational control.
Modern accounts receivable automation delivers a level of precision that manual systems cannot match. It is not about replacing people but empowering them with a tool that executes your collections strategy perfectly.
Moving Beyond the Manual Checklist
For a professional services firm, the right AR software acts as a central control system for collections. It orchestrates the entire process, from invoice dispatch to payment confirmation.
This systematic approach delivers immediate results:
- Error Elimination: An automated workflow never forgets a reminder or misses a follow-up. That consistency is what maintains a healthy A/R turnover ratio.
- Scalable Operations: Your team can manage a larger volume of accounts with greater precision, as the system handles repetitive tasks. This frees them to focus on high-value client interactions.
Automation transforms collections from a reactive, administrative function into a proactive, strategic asset.
This control is crucial for any firm focused on financial health. For a full analysis of available tools, our guide to accounts receivable automation software is a valuable resource.
* **Visual Idea: Cinematic image of a single controller at a clean desk calmly observing multiple automated workflows on a large monitor. The visuals on screen show emails and reminders being sent out to different clients simultaneously, symbolizing control and scale. ***
The Impact of AI AR Automation
True control comes from insight, not just execution. AI AR automation elevates the process by providing predictive analytics. An intelligent system personalizes communication at scale and forecasts payment behavior.
Imagine a system that flags clients likely to pay late before the due date, based on historical payment patterns and communication data. This allows your team to intervene proactively, preserving both the client relationship and your cash flow. Firms adopting this technology often achieve a 20-30% reduction in DSO.
For firms using common accounting platforms, integrating a solution like QuickBooks AR automation can immediately improve cash flow by closing the gap between invoicing and payment.
The goal is a predictable financial rhythm, where cash is collected consistently, A/R turnover remains high, and your team operates with calm control.
Key Questions for Financial Operators
Here are direct answers to common questions from financial leaders about managing the accounts receivable turnover ratio.
How Does QuickBooks AR Automation Help?
QuickBooks is an accounting system, not a collections platform. Dedicated QuickBooks AR automation tools integrate directly, pulling invoice and customer data to run a proactive collections strategy without manual data entry.
It automates reminders, tracks payment promises, and provides real-time A/R health dashboards. The result is a measurable increase in your turnover ratio and a reduction in administrative overhead.
What Is More Important: Turnover Ratio or DSO?
They are two sides of the same coin. The A/R turnover ratio is your efficiency score. Days Sales Outstanding (DSO) translates that score into a tangible timeline.
Most operators find DSO more practical for daily management because it is measured in days. However, both are necessary for a complete picture. A higher turnover always results in a lower DSO.
Can a High Turnover Ratio Be a Bad Thing?
Yes. An anomalously high ratio can indicate that credit policies are too restrictive.
An overly aggressive credit policy may turn away creditworthy clients who require standard industry payment terms, thereby constraining growth. The objective is not the highest possible ratio, but the optimal ratio that balances collection speed with sustainable client acquisition.
Does AR Automation Harm Client Relationships?
The opposite is typically true. Manual, inconsistent follow-ups can create awkwardness and friction.
AR software for professional services replaces this with a professional, predictable process. AI AR automation ensures communications are timely, polite, and accurate. It provides clients with clear information and easy payment options, removing the chaos from the collections process. This clarity and professionalism builds trust.
--- Resolut automates AR for professional services—consistent, accurate, and human. Learn more at https://www.resolutai.com.