What Is the DSO Metric? A Guide for Financial Operators
Answering 'what is the DSO' for professional services firms. Learn the DSO formula, industry benchmarks, and how to reduce DSO to improve your working capital.
Days Sales Outstanding (DSO) is not just another metric. For a professional services firm, it’s a direct measure of cash flow velocity and operational control.
DSO quantifies the average number of days it takes to convert services rendered into cash received. For a CFO or Controller, this number is a key lever for managing liquidity and business health.
Defining Days Sales Outstanding for Professional Services
In a business model driven by billable hours and project milestones, DSO provides a clear diagnostic of collections efficiency. It reflects the integrity of your credit policies and the effectiveness of your entire accounts receivable process.
A low DSO indicates rapid cash conversion, funding operations and growth. A high DSO signals that your working capital is trapped on your clients' balance sheets, not yours.
A rising DSO is a primary early warning signal. It indicates friction in the order-to-cash cycle that directly impacts your ability to forecast and operate with precision.
The DSO Calculation
The standard formula provides a clear, consistent measure of performance. It calculates the average number of days required to collect payment after a sale is made on credit.
The formula and its components are straightforward.
DSO Calculation at a Glance
Component | Description | Example Value |
|---|---|---|
Average Accounts Receivable | The average value of unpaid invoices over a specific period. | $1,200,000 |
Total Credit Sales | Your firm's total revenue generated on credit for the same period. | $12,000,000 |
Number of Days | The number of days in the period (typically 365 for a full year). | 365 |
Using these values, the formula is:
DSO = (Average Accounts Receivable ÷ Total Credit Sales) × 365
For our example firm: ($1,200,000 ÷ $12,000,000) × 365 = 36.5 days.
This calculation transforms raw AR data into a single, actionable key performance indicator.

Beyond the Number
DSO is a core component of the cash conversion cycle and a critical input for accurate cash flow forecasting. It is an operational metric that directly links daily activities to the firm's balance sheet.
Understanding the drivers of this number is the first step toward controlling it.
This metric is one piece of a larger financial system. To see how it fits into the complete client-to-cash journey, review our guide on the order-to-cash process. Each step, from contract to collection, influences financial stability.
By tracking DSO consistently, you can shift from reactive problem-solving to proactive financial management. Spot negative trends early, diagnose process weaknesses, and implement targeted improvements to accelerate cash flow.
This is where tools like accounts receivable automation provide a distinct operational advantage, converting a manual, variable process into a systematic, reliable one.
Establishing a Meaningful DSO Benchmark
A DSO of 45 days may represent strong performance for one firm but a critical issue for another. Context is essential.
Your DSO reflects your client base, billing model, and industry norms. To set a meaningful goal, you must benchmark against your specific peer group, not a generic average.
Industry-Specific Variations
Professional services is not a monolith. A law firm operating on retainers has a different cash flow cadence than an architecture firm managing large, milestone-based projects.
Key variables include:
- Billing Model: Monthly retainers typically result in a lower, more predictable DSO. Project-based billing can extend payment cycles.
- Client Profile: A few large, enterprise clients often pay slower than a diverse portfolio of smaller accounts.
- Service Niche: An engineering firm awaiting approvals on major infrastructure projects operates under different constraints than a management consultancy.
Benchmarking shifts the question from, "Is our DSO good?" to, "How do we achieve best-in-class performance within our specific market?" This change in perspective is fundamental to mastering cash flow.
What is a Good DSO Target?
A "good" DSO is one that is consistently at or below the average for your specific sector. A significantly higher number places you at a competitive disadvantage, as peers are deploying capital that you have tied up in receivables.
For professional services, general benchmarks are:
- Strong Performance: Under 30 days
- Average Performance: 30–45 days
- Poor Performance: Over 60 days
Even these are broad. Global data illustrates the variance. A recent logistics benchmark reported a global average DSO of 47 days, but in the U.S., it's often in the high 30s.
Every day matters. For a firm with $10M in annual revenue, reducing DSO by just one day frees up approximately $27,400 in cash. You can learn more about how DSO impacts global trade and cash flow management.
Knowing your industry benchmark empowers you to manage DSO, not just measure it. Tools like AI AR automation and optimized processes are critical. The goal is to tighten the entire collection cycle to fuel growth. For many firms, QuickBooks AR automation is the first step toward systemizing this process.
Calculating the True Cost of a High DSO
A high DSO is not an abstract accounting figure. It is a direct measure of earned revenue that you cannot deploy.
Every day an invoice remains unpaid, your capital is frozen. This is not just an accounting issue; it is a constraint on growth.
The cost is quantifiable. Each day added to your DSO traps a specific amount of cash in accounts receivable, increasing reliance on credit lines and undermining forecast accuracy.

The Trapped Capital Model
The calculation is simple: determine your firm's average daily revenue, then multiply it by your DSO. The result is the amount of cash locked in your AR process.
Daily Revenue = Annual Revenue / 365 Days
Trapped Capital = Daily Revenue x DSO
Consider a $20M firm. Its daily revenue is approximately $54,795. With a DSO of 60 days, nearly $3.3 million of its earned revenue is unavailable. This is capital that should be driving the business forward.
The Financial Impact of DSO Reduction
Now, quantify the impact of improvement. If that same $20M firm reduces its DSO from 60 to 45 days, the effect is substantial.
- DSO at 60 Days: $54,795 x 60 = $3,287,700 in trapped capital
- DSO at 45 Days: $54,795 x 45 = $2,465,775 in trapped capital
By reducing the collection cycle by 15 days, the firm immediately releases $821,925 in working capital. This is cash that moves from a receivable to a deployable asset.
Freeing this capital allows a firm to shift from a defensive to an offensive financial posture. That $821,925 can fund a new senior hire, a technology upgrade, or debt reduction.
This calculation demonstrates why an efficient AR process is a core strategic advantage. As we’ve covered before, the true cost of AR inefficiency in professional services impacts everything from operational stability to competitive positioning.
The Hidden Operational Costs
The direct financial drain is only part of the story. A high DSO creates significant secondary costs that erode profitability and operational health.
These indirect costs are equally damaging:
- Higher Borrowing Costs: Unpredictable cash flow necessitates reliance on credit lines. A high DSO means paying more interest on capital you have already earned.
- Lost Opportunities: The trapped $821,925 represents forgone investments—a strategic hire not made or a market opportunity missed.
- Strained Client Relationships: Adversarial, last-minute collection calls damage the trust built by your service delivery teams. A systematic, professional process avoids this friction.
- Wasted Team Resources: Your finance team's time is a high-value asset. Time spent chasing payments is time not spent on financial planning and strategic analysis.
Managing DSO is about building a more resilient financial foundation. By implementing disciplined processes and tools like accounts receivable automation, you can reclaim trapped capital and focus it on strategic priorities.
Diagnosing the Root Causes of a High DSO
To reduce DSO, you must first diagnose its drivers. A high DSO is a symptom of friction within your accounts receivable cycle. For financial operators, identifying these points of failure is the first step toward building a more resilient cash flow.
Most drivers fall into three categories: misaligned policies, inefficient processes, or inconsistent execution. A candid assessment of each area is required to move beyond treating symptoms.
The broader economy also plays a role. A recent report found that a mere two-day rise in global DSO was the primary driver of increased working capital needs for businesses. You can find more details in these global working capital and DSO trends on Allianz-trade.com.
Misaligned Financial Policies
The terms you establish upfront form the foundation of your AR process. Vague or unenforced policies create ambiguity that leads directly to payment delays.
Common policy failures include:
- Vague Payment Terms: "Net 30" is insufficient. Net 30 from when? The invoice date? Project completion? This lack of clarity creates opportunities for delay.
- Lax Credit Policies: Extending credit without a formal risk assessment exposes the firm to clients with a poor payment history.
- No Stated Late Fees: Without a clear, enforceable penalty for late payment, there is no financial incentive for clients' AP teams to prioritize your invoice.
Your contract is the first control in your AR process. If payment expectations are not clearly defined and agreed upon before work begins, you are already operating from a weak collections position.
Inefficient Internal Processes
Even with strong policies, broken internal workflows can sabotage collections. Manual, disconnected processes create delays, introduce errors, and consume valuable team resources. This is where the most significant opportunities to reduce DSO often reside.
Process bottlenecks that elevate DSO:
- Delayed Invoicing: Batching invoices at month-end adds an average of 15 days to your collection cycle before the clock even starts.
- Manual Invoice Creation: Manually transferring data from a project management system into QuickBooks invites errors. Errors lead to disputes, and disputes halt the payment process.
- Slow Dispute Resolution: Without a systematic process, invoice queries can linger for weeks, freezing the associated cash.
Inconsistent Execution and Follow-Up
The best policies and processes are ineffective without consistent execution. When collections are reactive and ad-hoc, a high DSO and unpredictable cash flow are guaranteed.
These execution failures are often symptoms of deeper policy and process issues. It manifests as a lack of disciplined follow-up, allowing invoices to age without intervention. This is where accounts receivable automation provides immediate impact, ensuring no invoice is overlooked. Effective AI AR automation replaces inconsistent manual effort with a reliable, systematic process.
Actionable Strategies to Reduce Your DSO
Reducing your DSO is about systematically removing friction from your collections process. It is not about adversarial client interactions. It is about operational discipline.
This is a playbook for improving your firm's cash flow, focused on practical actions across policy, process, and execution. Each strategy is designed to address a root cause of delay and tighten your collections cycle.
Fortify Your Financial Policies
A low DSO begins long before an invoice is issued. It starts with clear, firm policies that establish expectations from the outset of a client engagement.
Start by writing clear, protective contracts that explicitly define payment terms, milestones, and consequences for late payment.
Key policy adjustments include:
- Define Strict Payment Terms: Replace "Net 30" with a specific due date. Clarify that payment is due 30 days from the invoice date.
- Implement Upfront Deposits: For new clients or large projects, a 25-50% deposit secures commitment and improves your cash position immediately.
- Enforce Late Fees: State the penalty for late payment (e.g., 1.5% monthly interest) in the contract and on every invoice to create an incentive for timely payment.
Optimize Your Invoicing Process
Your internal process can either accelerate cash flow or impede it. Manual workflows are prone to delays and errors, each of which adds days to your DSO. The objective is to make invoicing as fast and accurate as possible.
Before automation, a firm might batch-send invoices at month-end, adding an average of 15 days to the collection cycle. Manual data entry from timesheets into QuickBooks often causes errors, leading to disputes that can freeze payment for weeks.
The After Scenario: By invoicing immediately upon milestone completion using an integrated system, you can cut 15-20 days from your collection cycle. This single process change has a direct impact on your cash balance.
A streamlined process prevents these self-inflicted delays. Fast, accurate invoicing is one of the most effective ways to increase cash flow.
Systematize Your Collections Communications
Inconsistent follow-up signals to clients that on-time payment is not a priority. A structured, professional, and persistent communication plan is essential. This is where accounts receivable automation is a critical tool.
An automated system can execute a precisely timed communication sequence, ensuring no invoice is forgotten and allowing the tone and frequency to escalate as an invoice ages.
A standard automated workflow includes:
- Pre-Due Date: A professional reminder is sent 3-5 days before the due date.
- Day 1 Past Due: An immediate notification confirms the invoice is overdue.
- Day 15 Past Due: The tone becomes more direct, referencing contract terms and late fees.
- Day 30 Past Due: An internal alert prompts a team member to make a personal call.
This flowchart illustrates how weak policies, inefficient processes, and poor execution contribute to a high DSO.
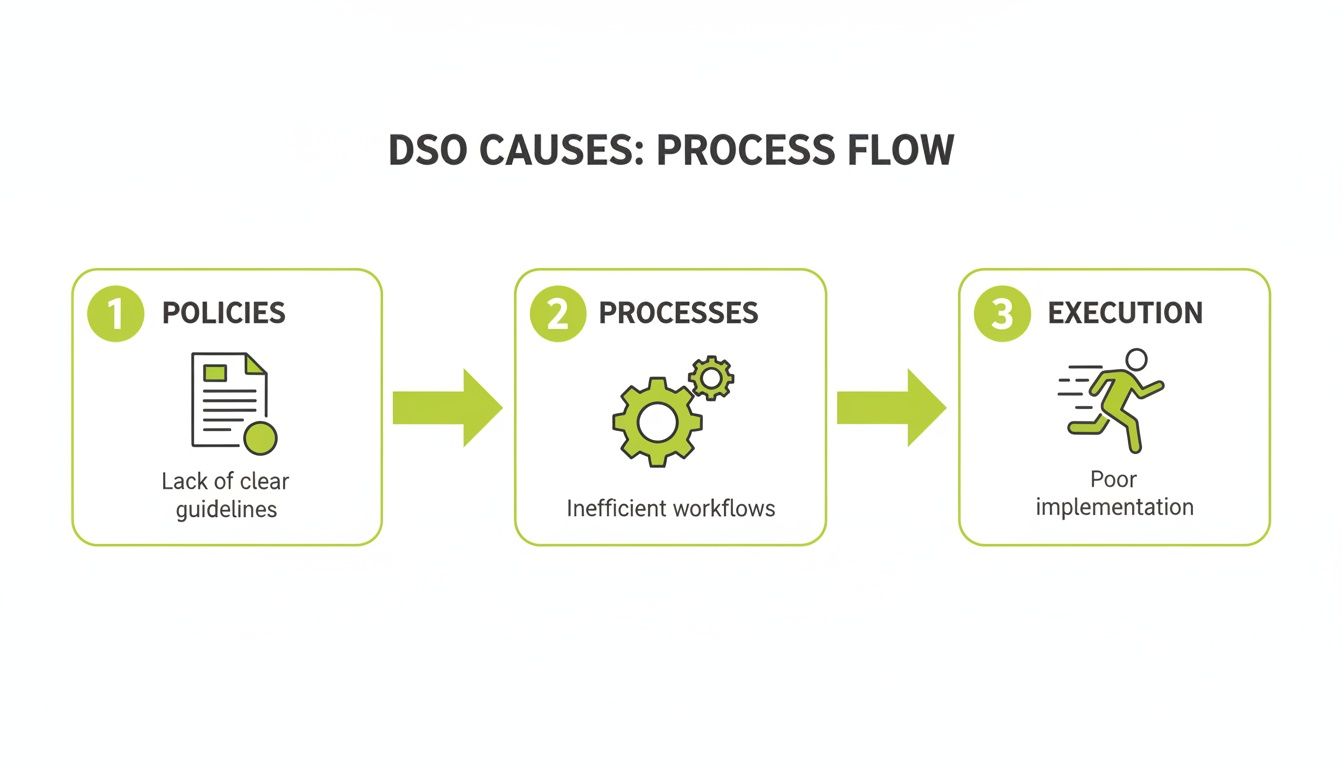
A high DSO is rarely a single problem but the result of multiple small breakdowns across the AR lifecycle.
Leverage AR Software for Professional Services
Modern AI AR automation platforms are designed to execute these strategies with precision. They provide the operational infrastructure needed to maintain control over your receivables portfolio.
For firms using QuickBooks, QuickBooks AR automation tools add an intelligent layer to your accounting software. They pull invoice data in real-time and execute your collections playbook automatically.
The benefits are measurable:
- Reduced Manual Work: Firms report up to an 80% reduction in time spent on manual collections, freeing the finance team for higher-value analysis.
- Improved Accuracy: Automation eliminates human error in communications and tracking, reducing payment disputes.
- Centralized Visibility: A single dashboard allows you to monitor AR health, identify at-risk accounts, and forecast cash collections with greater confidence.
Combining these strategies creates a resilient and predictable accounts receivable system, transforming AR from a reactive task into a strategic asset.
How to Measure and Monitor AR Health Over Time
Managing DSO is a continuous discipline, not a one-time project. Consistent measurement is essential to maintaining control over your firm’s cash flow.
While DSO is the headline metric, a healthy AR process is monitored through a small set of key performance indicators (KPIs) that provide a more complete picture.
This practice enables proactive financial management, where data—not crisis—drives decisions. It transforms AR from a source of stress into a predictable operational function.
Key Metrics for Your AR Dashboard
Your AR dashboard should provide an immediate, clear view of financial health, highlighting potential issues long before they become critical.
Beyond DSO, these metrics are essential:
- Aged Receivables Analysis: This is the foundation of AR management. It segments unpaid invoices into aging buckets (e.g., 0-30 days, 31-60, 61-90, and 90+). A growing balance in the older buckets is a clear indicator of declining AR health and a leading indicator of a future rise in DSO.
- Collection Effectiveness Index (CEI): This metric measures how much cash was collected versus the total receivables available for collection in a given period. A score closer to 100% indicates a highly efficient collections process.
CEI measures the effectiveness of your collections process, while DSO measures the outcome. Monitoring both provides a complete diagnostic. It helps determine if a rising DSO is due to process inefficiency or other factors, such as a shift in client payment terms.
Turning Data into Action
Monitoring these metrics is about knowing when and where to intervene.
When the 61-90 day aging bucket grows, you know precisely which accounts require immediate, focused attention. This is where accounts receivable automation provides a significant advantage.
Effective AR software for professional services acts as this central dashboard, visualizing trends automatically. Many platforms offer direct QuickBooks AR automation, pulling data in real-time for up-to-the-minute accuracy.
For example, a platform like Resolut can flag an account whose payment behavior has deteriorated, even before invoices are technically past due. This allows for proactive outreach that preserves the client relationship while guiding them back to timely payment. It turns raw data into a predictive early warning system.
By establishing and consistently monitoring a core set of AR health metrics, you create a feedback loop for continuous improvement. This provides the visibility needed to manage cash flow with confidence.
Common Questions About DSO for Financial Operators
For CFOs and Controllers focused on optimizing cash flow, here are direct answers to common questions about managing Days Sales Outstanding.
How often should we calculate and review DSO?
For most professional services firms, a monthly review cadence is optimal. This frequency is sufficient to identify meaningful trends without overreacting to short-term collection fluctuations.
Aligning your DSO review with the monthly financial close allows for consistent comparison against prior periods and forecasts. During periods of high growth or tight liquidity, a weekly review of aged receivables can serve as an effective early warning system.
What is the difference between DSO and DPO?
DSO measures the efficiency of collecting cash from clients (an asset), while Days Payable Outstanding (DPO) measures the efficiency of paying your own suppliers (a liability).
- DSO reflects the performance of your AR function.
- DPO reflects the management of your accounts payable.
Effective working capital management involves balancing these two metrics. A low DSO combined with an optimized DPO can significantly improve a firm's cash position. However, extending DPO too far can damage key supplier relationships.
Can AR automation software integrate directly with QuickBooks?
Yes. For modern AR software for professional services, seamless integration is a baseline requirement, not an optional feature. These platforms are engineered to connect directly with accounting systems like QuickBooks and other ERPs.
This QuickBooks AR automation is critical for eliminating manual data entry and ensuring that collection activities are based on real-time, accurate financial data. It establishes a single source of truth, enabling the finance team to manage AR strategically.
--- Resolut automates AR for professional services—consistent, accurate, and human. Learn more at https://www.resolutai.com.