How to Calculate Average Collection Period to Improve Cash Flow
Learn how to calculate average collection period with our operator's guide. Get the formula, examples, and strategies to improve your firm's cash flow.
To calculate your average collection period, divide your average accounts receivable by net credit sales, then multiply by the number of days in the period (typically 365).
That is the formula. It's simple, but the resulting number precisely measures how many days it takes your firm, on average, to convert an invoice into cash.
Why Your Average Collection Period Is More Than Just a Number
For financial operators, the average collection period is a direct read on your firm's liquidity and operational efficiency. It’s not just another KPI; it is a vital sign for cash flow.
A high number signals friction in your process—perhaps in invoicing, client communication, or your collections follow-up.
Mastering this metric is the first step in transforming accounts receivable from a reactive, administrative function into a strategic cash flow engine. It is how you gain control over your firm’s financial pulse.
The Core Components of the Metric
The average collection period, also known as Days Sales Outstanding (DSO), is a critical tool for gauging how efficiently you convert services into cash. The calculation is: (Average Accounts Receivable / Net Credit Sales) × 365.
For example, if your firm has an average AR of $500,000 and net credit sales of $5,000,000, your collection period is 36.5 days. You can find more details on why this metric matters and other payment collection statistics for businesses at clearlypayments.com.
This is not a vanity metric. It directly impacts your working capital.
A prolonged collection period ties up critical cash that could be invested in growth, talent, or technology. A 10-day reduction for a firm with $10M in revenue can unlock over $270,000 in working capital.
[Visual Idea: A simple line chart showing DSO trending downward over six months, with a callout box highlighting the corresponding increase in available working capital.]
A Barometer for Operational Health
Tracking this metric over time provides direct insight into your firm's operational discipline. An upward trend is an early warning system, identifying specific breakdowns long before they become systemic cash flow problems.
It forces you to ask the right questions:
- Invoice Accuracy: Are invoices clear, correct, and delivered on time?
- Client Onboarding: Are payment terms defined explicitly in client agreements?
- Collections Process: Is your follow-up consistent, professional, and effective?
Just as your average collection period tells a story about your operational efficiency, other key financial ratios, like the Debt Service Coverage Ratio (DSCR), provide a broader view of your business's ability to manage its financial obligations.
When you master this calculation, you can move from reporting the number to actively managing it. For a professional services firm focused on efficient scaling, that control is non-negotiable.
A Practical Walkthrough of the Calculation
The formula for the average collection period is straightforward. The critical task is ensuring the inputs are accurate. Imprecise data renders the metric useless. For professional services firms, this means pulling surgically precise figures from your ERP or accounting platform like QuickBooks.
The objective is not just to get a number—it's to build a trustworthy and repeatable process. Let's review how to isolate the correct data for both annual and monthly calculations.
This process tracks the timeline from service delivery to cash receipt.
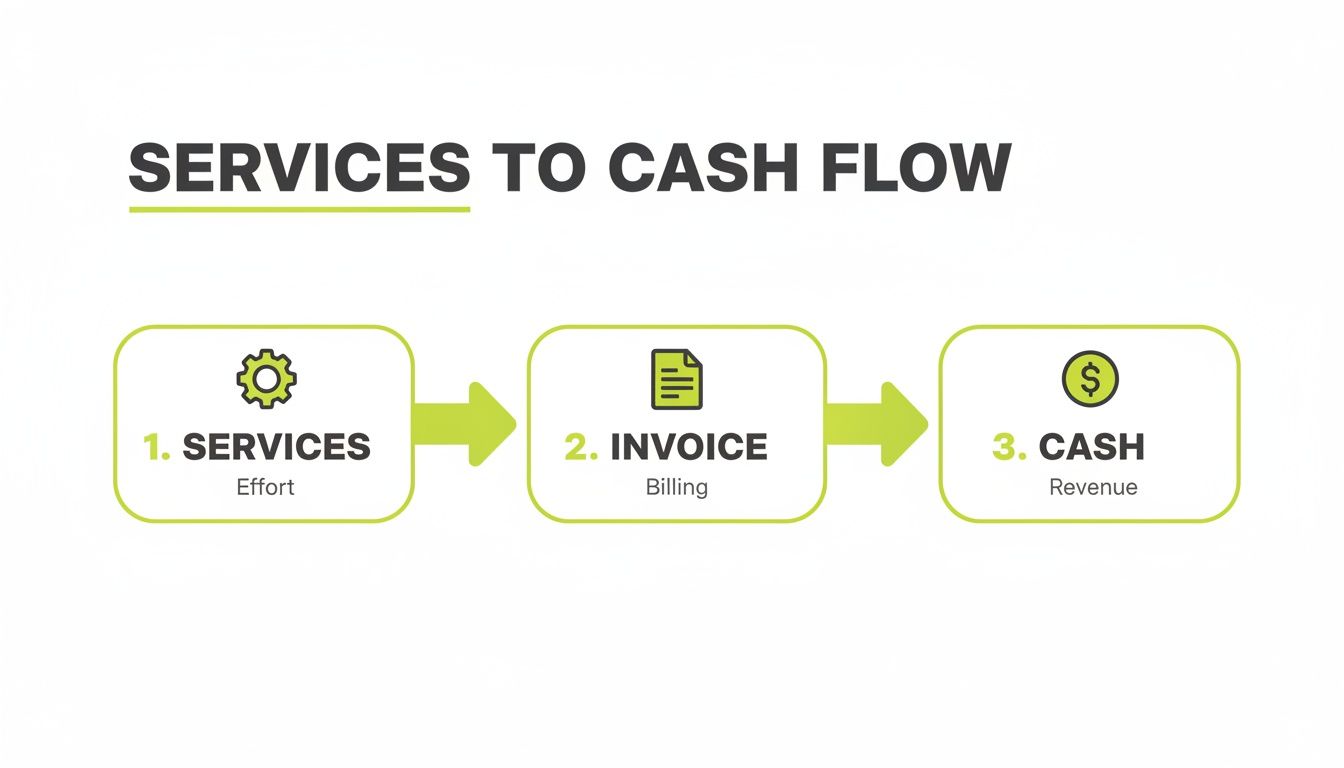
Consider every step in that flow a potential bottleneck. Each delay adds days to your collection period and constrains your cash flow.
Securing the Right Inputs
Before calculating, you need two key figures. Errors here undermine the entire analysis.
- Net Credit Sales: This is your total revenue from services sold on credit for the measured period. It is critical to exclude cash sales and upfront retainers. Including them will artificially lower your DSO and mask collection issues.
- Average Accounts Receivable: Do not use the ending AR balance. A true average smooths out fluctuations from large projects or seasonal billing. The formula is (Beginning AR + Ending AR) / 2. This provides a more accurate operational view.
Using QuickBooks, you can find Net Credit Sales by running a "Sales by Customer Summary" report, filtered for transactions with payment terms. Your AR balances are on the Balance Sheet for the period's start and end dates.
Whether you're taking a strategic annual view or a tactical monthly one, the components are the same—but the time period is key.
Monthly vs. Annual Calculation Inputs and Formulas
Component | Monthly Calculation | Annual Calculation |
|---|---|---|
Time Period | The number of days in the specific month (e.g., 30, 31). | 365 days. |
Net Credit Sales | Total credit sales for that month only. | Total credit sales for the entire year. |
Average AR | (Beginning AR of the month + Ending AR of the month) / 2. | (Beginning AR of the year + Ending AR of the year) / 2. |
Formula | (Average AR / Monthly Net Credit Sales) × Days in Month. | (Average AR / Annual Net Credit Sales) × 365. |
This table highlights why context is critical. Using annual sales data for a monthly calculation will produce a meaningless number.
Example 1: The Annual View
An architecture firm is running its annual analysis to establish a strategic baseline.
- Time Period: 365 days
- Net Credit Sales (Annual): $5,000,000
- Beginning AR (Jan 1): $650,000
- Ending AR (Dec 31): $750,000
First, calculate the Average Accounts Receivable for the year: ($650,000 + $750,000) / 2 = $700,000
Now, apply the annual formula: ($700,000 / $5,000,000) × 365 = 51.1 days
On average, it takes this firm 51.1 days to collect payment. This is their annual benchmark.
Example 2: The Monthly Check-In
Now, the same firm analyzes its March performance. This tactical view is crucial for early problem detection.
- Time Period: 31 days (for March)
- Net Credit Sales (March): $415,000
- Beginning AR (Mar 1): $710,000
- Ending AR (Mar 31): $760,000
First, the Average AR for March: ($710,000 + $760,000) / 2 = $735,000
Next, apply the formula using the days in March: ($735,000 / $415,000) × 31 = 54.9 days
The firm’s collection period for March is nearly four days longer than its annual average. This requires investigation. The firm must now identify which clients or projects are causing the delay.
Comfort with this calculation is fundamental for financial leadership. And similar principles apply when you master other key performance indicators like Average Handle Time, where precision drives better operational decisions. Clean inputs lead to clear strategy.
Interpreting Your Results: What a Good Collection Period Looks Like
You have the number. What does it mean for the business?
A standalone collection period is just data. Its value comes from context—how it compares to industry benchmarks and, more importantly, its internal trend over time.
A “good” DSO is relative. A 75-day period may be acceptable for a large engineering firm with milestone-based contracts. For a marketing agency on monthly retainers, it would signal a critical issue.
Industry Benchmarks for Professional Services
Generic benchmarks are useless. A professional services firm comparing its performance to retail or manufacturing gains no realistic insight. You must benchmark against your peers to understand your position and improve cash flow.
Different professional services operate on different collection cycles. The construction industry often sees a DSO around 70 days. Architectural and engineering firms may average 74.4 days, while foundation contractors might be closer to 67.5 days.
These nuances are why industry-specific benchmarks are essential. You can find more detail on industry-specific timelines at sage.com.
If your firm’s DSO is significantly higher than your industry average, it indicates an operational drag requiring attention. The goal is not just to meet the standard, but to outperform it.
The Power of Internal Trend Analysis
While industry data provides an external baseline, your most powerful diagnostic tool is internal trend analysis. Tracking your average collection period month-over-month reveals your true financial trajectory.
A stable or declining DSO demonstrates control. An upward trend, however slight, is an early warning that a process has failed.
A rising collection period is rarely a fluke. It is a symptom of a breakdown—inefficient invoicing, ambiguous payment terms, or inconsistent follow-up. Identifying a 3-day increase this month prevents it from becoming a 10-day problem next quarter.
This consistent monitoring is a pillar of effective receivable management services. It transforms a lagging indicator into a proactive operational guide.
From Diagnosis to Action
Interpreting your results connects the calculation to a concrete plan.
If your collection period is 65 days against an industry average of 50, you have a 15-day gap to close. That is a direct measure of inaccessible working capital.
This is where the right tools become a strategic asset. By implementing AR software for professional services, you can address the root causes of collection delays. With accounts receivable automation, you can systematize invoicing and follow-ups. Tools offering QuickBooks AR automation sync directly with your ledger to streamline the process.
Using AI AR automation helps to directly reduce DSO by ensuring every client receives timely, professional, and persistent communication—without manual intervention. That consistent, programmatic pressure shortens the payment cycle.
Common Data Mistakes That Skew Your Results
An accurate average collection period depends on clean data. Flawed inputs produce a useless output. For controllers and finance leaders, defending the integrity of this metric is paramount.
Small errors can create a misleading picture of your firm's financial health. The most common mistake is including cash sales or retainers in your Net Credit Sales figure. These funds do not pass through a receivable process; including them artificially lowers your collection period, masking underlying problems.

Another frequent error is mismatched timeframes—pairing annual sales with a monthly AR average, for example. This will always produce a distorted, unreliable number. Your sales and receivables data must cover the exact same period.
Accounting for Volatility and Outliers
Professional services firms rarely have smooth revenue cycles. Seasonality and large, one-off projects can introduce significant volatility that distorts your average collection period.
A single multi-million dollar invoice with net-90 terms can inflate your average, making one month appear far worse than it is. This can trigger false alarms or, worse, mask real improvements in your daily collections process.
To get a clearer picture, you must segment the data:
- Segment Your Analysis: Calculate the collection period separately for standard retainer work versus large, milestone-driven projects. This reveals the true performance of each revenue stream.
- Normalize the Data: For reporting, consider excluding exceptionally large or unusual invoices from the primary calculation. Analyze them separately to understand their impact without distorting the overall metric.
The goal is to produce a metric that reflects true operational performance, not one skewed by outliers. Clean data ensures you address real problems, not ghosts in the machine.
Data integrity is the foundation of sound financial management. This is where the value of accounts receivable automation becomes clear. Solutions using AI AR automation can standardize data entry and reporting, which is one of the key accounts receivable automation benefits leading to more reliable metrics and better decisions.
Actionable Strategies to Reduce Your Collection Period
Knowing your collection period is step one. Reducing it is what matters.
For a professional services firm, shortening this cycle unlocks working capital and provides greater operational control.
This is not about aggressive collection tactics. It is about systematic process improvements that remove payment friction. Each strategy here is designed to directly reduce the components of your average collection period calculation.

[Visual Idea: A cinematic, high-contrast shot of a CNC machine or 3D printer precisely creating a physical object, representing the precision of automated AR systems.]
The stakes are high. The global debt collection services market is projected to reach USD 30.5 billion by 2025, an indicator of the capital lost to collection friction. You can review the scope of the debt collection market at cognitivemarketresearch.com.
A firm with $10 million in annual credit sales can increase its cash position by over $270,000 by cutting its DSO by just 10 days.
Fortify Your Contract and Invoicing Process
Your collections process begins when a contract is signed, not when an invoice is late.
Ambiguity in your agreements guarantees delays. Contracts must clearly define payment terms, due dates, and consequences for late payments. Leave no room for interpretation.
Invoices must be equally precise: clean, itemized, and sent immediately upon work completion or milestone achievement. A confusing or delayed invoice gives a client a valid reason to de-prioritize payment.
Implement Systematic and Automated Follow-Up
Manual follow-up is inherently inconsistent. It depends on an individual's memory, schedule, and comfort level with collection conversations. This is where accounts receivable automation provides a distinct advantage.
An automated system ensures every client receives timely, professional, and persistent reminders. The goal is not to harass, but to create a predictable rhythm of communication that keeps your invoice top of mind.
A simple, automated reminder sent three days before an invoice is due prevents a significant percentage of late payments. It reframes the interaction from a confrontational collection call to a helpful advisory.
Effective AR software for professional services allows for customized communication cadences. You can apply different approaches for high-value clients versus smaller accounts, ensuring the tone always fits the relationship. This is a core tactic for firms implementing new ways to increase cash flow.
Leverage Technology to Remove Payment Friction
Every additional click or form field is a point of friction that invites payment delay. Making it easy for clients to pay is a business imperative.
- Offer Diverse Payment Options: Accept credit cards, ACH transfers, and digital wallets through a secure online portal.
- Automate Reconciliation: Use tools offering QuickBooks AR automation to sync payments and close invoices automatically, eliminating administrative overhead.
- Use AI for Prioritization: Modern AI AR automation can analyze payment histories to flag at-risk accounts before they become delinquent, helping your team focus its efforts effectively.
By implementing these strategies, you can methodically reduce DSO and build a more financially resilient firm. The objective is to build an AR system as professional and efficient as the services you deliver.
Common Questions
Is Average Collection Period the Same Thing as DSO?
Yes, for practical purposes, Average Collection Period and Days Sales Outstanding (DSO) are the same metric. Both measure the average number of days it takes to collect payment after a credit sale.
The formulas are identical. "Average Collection Period" is more descriptive, but DSO is the common acronym in financial discussions. Both measure your efficiency in converting receivables to cash.
How Often Should We Be Calculating This?
For most professional services firms, a monthly calculation is optimal. It provides a timely performance read without being distorted by daily fluctuations. A monthly cadence is frequent enough to detect negative trends before they escalate.
Some firms prefer a rolling three-month average to smooth out single-month outliers and reveal the underlying collections trend. This is an effective way to measure if your efforts to reduce DSO are working over time.
A very low collection period is not always optimal. It could indicate that your credit terms are too restrictive, potentially deterring qualified clients who require standard payment flexibility.
For example, if the industry standard is net-45 and your firm demands net-10, you may be losing business. The goal is not the lowest possible number, but the optimal balance between strong cash flow and client relationships.
--- Resolut automates AR for professional services—consistent, accurate, and human. Learn more at https://www.resolutai.com.