A CFO's Guide to Calculating Accounts Receivable Turnover
A practical guide for CFOs on calculating accounts receivable turnover to improve cash flow, reduce DSO, and optimize your collections process.
Calculating your accounts receivable turnover ratio measures how efficiently your firm converts invoices into cash. It reveals how many times, on average, your firm collects its receivables balance over a year.
Think of it as a key performance indicator for your collections process. A higher ratio signifies faster collections and healthier cash flow.
Why AR Turnover Is a Core Metric for Firm Health
For a professional services firm, cash flow is the operational lifeblood. Accounts receivable turnover isn't an abstract accounting metric; it’s a direct signal of your firm's ability to convert billable hours into cash.
This makes it a primary KPI for judging financial stability and operational control. A high turnover ratio reduces the need for external financing and frees up capital for investment.
A strong turnover ratio means your largest current asset—accounts receivable—is liquid and productive, not a drag on the balance sheet. This is about command of your firm's financial engine.
The Real Cost of Slow Collections
Slow collections are an operational tax on your firm. In the U.S., a staggering 55% of all B2B invoiced sales are currently past due.
This operational drag explains why 75% of finance leaders now see AR as a more strategic priority. Every delayed payment represents trapped working capital.
When collections lag, firms often rely on lines of credit, eroding profitability with unnecessary interest payments.
A low turnover ratio is a leading indicator of future cash flow problems. It signals underlying issues in credit policies, invoicing, or collections that require immediate attention.
A Stress Test for Your Financial Engine
Your AR turnover ratio is a stress test for your entire financial process. It provides an unfiltered view of client payment behavior and the effectiveness of your internal systems.
A firm grasp of all working capital components, including understanding what is accounts payable and receivable, is foundational. Improving this metric is a direct route to building a more resilient, self-sufficient firm.
*Visual Idea 1: A cinematic shot of a sleek, modern professional services office with a digital dashboard in the foreground. The dashboard prominently displays an upward-trending AR turnover ratio graph, symbolizing control and financial health. * Visual Idea 2: A simple, clean line chart comparing two professional services firms. Firm A has a high, stable AR turnover ratio, while Firm B's ratio is low and volatile. Key points like "Reduced Borrowing Costs" and "Increased Investment Capacity" are annotated on Firm A's line. ***
Calculating The AR Turnover Ratio With Precision
When calculating your AR turnover ratio, precision is non-negotiable. Flawed inputs produce a flawed ratio, leading to poor strategic decisions.
For any finance operator, getting this right starts with a solid understanding of the two components of the formula.
The formula is straightforward:
AR Turnover Ratio = Net Credit Sales / Average Accounts Receivable
This ratio tells you how many times your firm collected its average receivables balance over a specific period. A higher number indicates operational efficiency.
Getting Your Inputs Right
The most common error is using total sales instead of Net Credit Sales. This simple mistake skews the entire calculation.
Total sales includes cash transactions, which are irrelevant to your collections process. Including them artificially inflates your turnover ratio and masks potential AR issues.
To get an accurate picture, you must isolate the revenue you are actively trying to collect.
Component | Definition | What to Include | What to Exclude |
|---|---|---|---|
Net Credit Sales | The total revenue generated from sales on credit, after accounting for returns and allowances. | All sales made on credit terms. | Cash sales, sales returns, sales allowances. |
Average Accounts Receivable | The mean value of accounts receivable over a specific period. | The beginning AR balance and the ending AR balance for the period. | One-off, single-point-in-time AR figures that don't reflect the period average. |
This table shows why isolating Net Credit Sales is critical. For a more detailed guide on this specific calculation, check our post on how to calculate Net Credit Sales.
The other component, Average Accounts Receivable, is equally important. Using a single month-end balance is misleading, as it fails to account for seasonality or large, one-off projects.
To smooth out fluctuations and achieve a representative figure, calculate the average over the period being measured.
Average AR = (Beginning AR Balance + Ending AR Balance) / 2
This approach provides a more stable and accurate measure of the receivables your team managed throughout the year.
This flowchart illustrates how a precise AR turnover calculation connects your firm's billable work directly to its overall financial health.
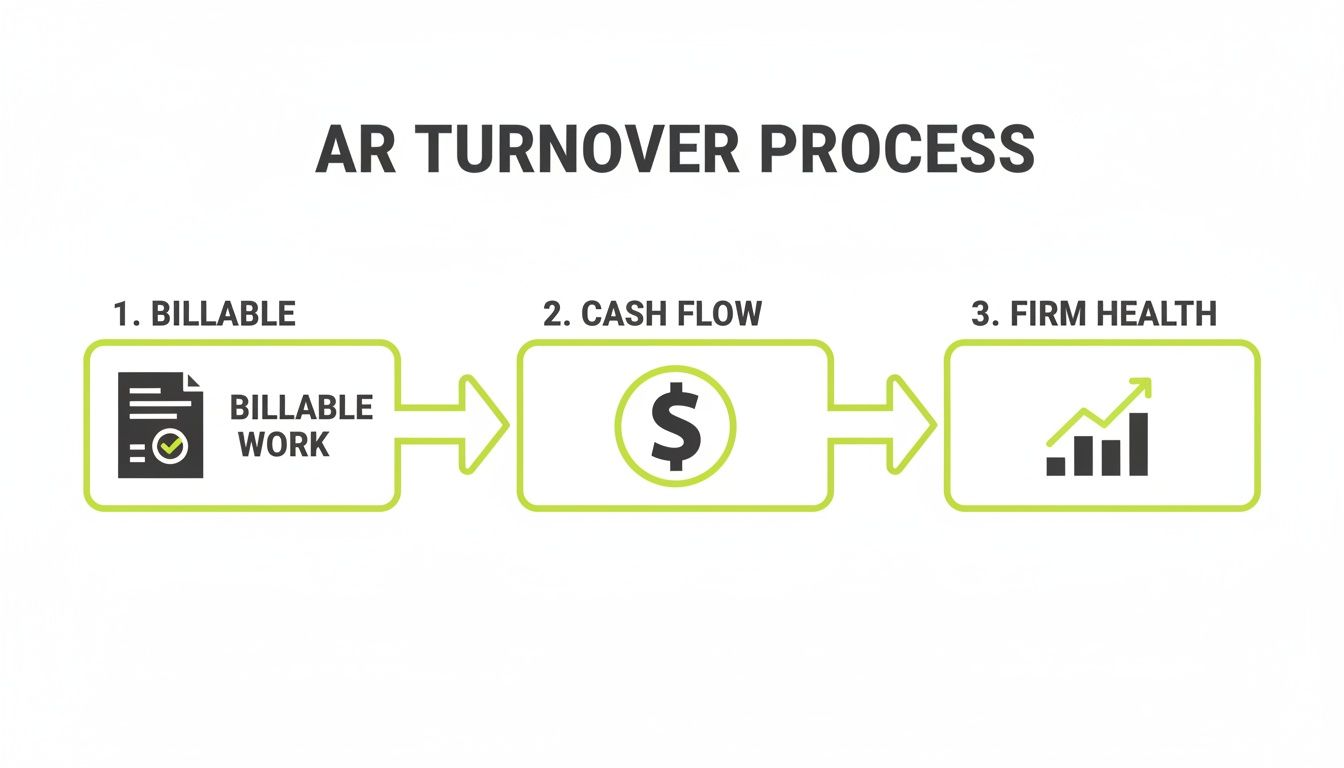
A well-managed AR process is the engine that converts your services into the cash flow required for growth.
A Practical Example
Let's walk through an example for a $10M professional services firm. Here are their annual figures:
- Gross Annual Sales: $10,000,000
- Cash Sales: $500,000
- Sales Returns & Allowances: $200,000
- Beginning AR Balance (Jan 1): $1,100,000
- Ending AR Balance (Dec 31): $1,300,000
First, calculate Net Credit Sales: $10,000,000 (Gross Sales) - $500,000 (Cash Sales) - $200,000 (Returns) = $9,300,000
Next, calculate Average Accounts Receivable: ($1,100,000 + $1,300,000) / 2 = $1,200,000
Now we have the inputs for the AR Turnover Ratio: $9,300,000 / $1,200,000 = 7.75
This firm collects its average receivables approximately 7.75 times per year. To manage this data effectively, using the best accounting software is essential.
This precise calculation is the foundation of any effective cash flow strategy. Without it, you are navigating blind, unable to accurately diagnose collection issues or measure the impact of improvements.
A structured approach ensures your ratio is a reliable indicator of operational performance.
What Your Turnover Ratio Actually Tells You
You've calculated your turnover ratio. Let's say it's 8. A number alone is data, not insight. The value comes from translating that number into a story about your firm's financial health.
Knowing you turn over receivables eight times a year is abstract. A more practical question is, "How many days does it take us to get paid?" This is where Days Sales Outstanding (DSO) comes in.
From a Ratio to a Real-World Timeline
Converting your turnover ratio into DSO transforms an abstract metric into a tangible timeline for your collections cycle. It reveals exactly how long your cash is tied up in unpaid invoices.
The formula is simple: DSO = 365 / Accounts Receivable Turnover Ratio
Let's return to our example firm with a turnover ratio of 7.75.
365 / 7.75 = 47.1 days
On average, it takes this firm just over 47 days to convert an invoice into cash. Suddenly, the ratio of 7.75 has a clear operational meaning. For a deeper dive, review our guide to understanding Days in Accounts Receivable.
Is Your DSO Good or Bad? It's All About Context
You have your DSO. The next question is whether it's a good number. The answer depends entirely on your industry and client terms.
For professional services, a DSO between 30 and 60 days is a common range. Top-performing firms consistently operate at the lower end of this spectrum.
If your DSO creeps above 60 days, it’s a warning sign. It indicates a breakdown in your process, whether from lax credit policies, delayed invoicing, or inconsistent follow-up.
The final step is to diagnose the root cause. Are invoices delayed? Are payment terms vague? Is follow-up inconsistent? A high DSO is rarely from one single issue but a series of small inefficiencies.
This is where targeted tools make a significant impact. The right AR software for professional services, particularly systems offering QuickBooks AR automation, can systematically plug these leaks. Implementing accounts receivable automation standardizes collections outreach, ensuring no invoice is forgotten. This approach is a direct path to reduce DSO and improve cash flow. With AI AR automation, you can even begin to anticipate payment behaviors before they become problems.
*Visual Idea 1: A cinematic image of a controller looking at a tablet displaying a dashboard. The main KPI is a large, clear number showing "DSO: 47 Days," with a subtle downward trend line, indicating improving performance and control. * Visual Idea 2: A simple bar chart comparing the DSO of three different professional services firms. "Firm A (Automated AR)" shows a low DSO of 35 days. "Firm B (Industry Average)" is at 47 days. "Firm C (Manual Process)" has a high DSO of 65 days, visually demonstrating the impact of automation. ***
Common Calculation Mistakes That Distort Your Financial Picture
An incorrect accounts receivable turnover calculation is worse than none at all. An inaccurate ratio creates a false sense of security or undue panic, leading to poor strategic decisions.
To build analysis on solid ground, inputs must be treated with absolute precision. Even experienced finance teams can fall into common traps that distort the final ratio.

Using Gross Sales Instead of Net Credit Sales
This is the most frequent and impactful error. Using gross sales includes cash transactions, which have no bearing on your collections process.
Including cash sales in the numerator artificially inflates your turnover ratio, making collections appear more efficient than they actually are. This one change can take a healthy-looking ratio and reveal a more realistic, and often concerning, picture of operations.
Calculating Average AR from a Single Data Point
Using a single month-end or quarter-end AR balance for your denominator is another critical mistake. A large invoice issued just before period-end can dramatically inflate ending AR, making turnover look deceptively low.
Conversely, a large payment received on the last day can make the ratio appear artificially high. Averaging the beginning and ending AR balances smooths these fluctuations, providing a more representative figure.
A distorted AR turnover ratio doesn't just impact an internal report; it affects everything from cash flow projections to credit policy reviews. A small input error can lead to a significant strategic misstep.
Overlooking the Impact of Outliers
Unusual events can skew your data. A massive, one-time project with atypical net-90 terms will remain on your books longer than standard invoices, dragging down the overall ratio.
When a sudden swing in your turnover ratio occurs, investigate for outliers. It is often insightful to run the calculation both with and without the outlier data to understand the true underlying performance of your standard collections process. Getting this right is fundamental to any effort to reduce DSO and improve cash flow.
Actionable Strategies to Improve Your AR Turnover
A low accounts receivable turnover ratio is a diagnostic signal. It indicates it's time to refine your processes and accelerate cash collection. The key is to implement hands-on strategies that deliver measurable outcomes.
This begins with a thorough review of your entire order-to-cash cycle. Even minor friction points can aggregate into payment delays that strain working capital.

Nail the Fundamentals First
Before investing in new software, ensure your foundational processes are sound. Technology cannot fix a broken operational core. The goal is to eliminate friction for both your team and your clients.
Three areas demand immediate focus:
- Refine Your Credit Policies: Are you assessing a new client’s creditworthiness, or extending terms based on a gut feeling? A clear, standardized credit policy is your first line of defense.
- Make Your Invoices Crystal Clear: Every invoice should be a foolproof call to action. It needs a prominent due date, a line-by-line service breakdown, and multiple, easy payment options. Confusion is a primary driver of payment delays.
- Systematize Your Follow-Up: Collections outreach cannot be random. A documented schedule of reminders—ideally starting before the due date—ensures consistent follow-up.
Disciplined manual steps create the foundation for more impactful changes that directly improve cash flow and reduce DSO.
A firm with a disciplined, documented AR process will always outperform one that relies on reactive, manual effort. Consistency is the engine of an efficient collections cycle.
The Power of AR Automation
For a professional services firm, the single biggest leap forward is accounts receivable automation. This isn't about replacing people; it's about equipping them with tools that execute fundamental processes with perfect consistency and scale.
Modern AR software for professional services changes the game. A smart system, especially one with QuickBooks AR automation, ensures no invoice is overlooked. It converts your outreach plan into an automated workflow, freeing your team to focus on complex client issues.
The measurable impact is significant. Collection times can vary widely; management companies can see average collection periods exceed 125 days. For a $10 million revenue firm, that means roughly $3.4 million is tied up in receivables.
Using AI AR automation can shorten this cycle dramatically by personalizing outreach and flagging at-risk accounts before they become delinquent. You can learn more in our guide on what to look for in accounts receivable automation software.
This is where the metric—your AR turnover ratio—connects directly to a solution. By ensuring timely, professional, and consistent follow-up, you accelerate payment and protect client relationships.
Answering Your Top Questions About AR Turnover
As finance leaders, we know the real work begins after the numbers are crunched. Calculating your accounts receivable turnover is the starting point; the strategic value comes from understanding what it means and how to act on it.
What’s a Good AR Turnover Ratio for a Professional Services Firm?
There is no single magic number, but a healthy AR turnover ratio for most professional services firms falls between 6 and 10.
This range translates to a Days Sales Outstanding (DSO) of roughly 36 to 60 days. A ratio above 10 indicates an excellent collections process. A ratio below 6 signals that your credit policies or collections strategy requires review.
The goal isn't just the highest possible number. A stable, predictable ratio is more valuable. A consistent turnover of 8, for instance, is better for forecasting than a ratio that bounces wildly between 5 and 11 each quarter.
Can Our AR Turnover Ratio Be Too High?
Yes. An extremely high ratio can be a red flag.
While it often points to an efficient collections team, it could also signal that your credit policies are too restrictive. If you only extend credit to the most bulletproof clients, you may be turning away good business and stunting growth.
*Visual Idea: A cinematic, slightly desaturated image of a controller in a modern office, thoughtfully reviewing a financial dashboard on a large screen. The focus is on their expression of calm analysis, not on the screen's data itself, conveying strategic oversight. *
How Does AR Automation Directly Impact This Ratio?
Accounts receivable automation directly improves the turnover ratio by making the collections process faster and more systematic. It institutionalizes your follow-up cadence.
Specialized AR software for professional services, particularly systems offering QuickBooks AR automation, ensures every invoice receives consistent, timely attention without manual effort.
This approach closes the gaps where human error or competing priorities cause delays. By automating reminders and offering digital payment options, you make it easier for clients to pay you, which is one of the fastest ways to reduce DSO.
Modern AI AR automation can intelligently prioritize outreach to at-risk accounts, tightening the collections cycle even further. The real win is consistency, which creates predictable cash flow you can build on.
--- Resolut automates AR for professional services—consistent, accurate, and human. Learn more at https://www.resolutai.com.