A CFO’s Guide to the Accounts Receivable Turnover Calculation
Master the accounts receivable turnover calculation to improve cash flow and reduce DSO. A clear guide for finance leaders in professional services.
The accounts receivable turnover calculation is a primary indicator of your firm’s financial efficiency. It measures how effectively you convert invoices into cash over a given period.
A high turnover ratio indicates strong collections and healthy cash flow. A low ratio is a clear signal of potential working capital issues.
Why AR Turnover Is a Critical Health Metric

As a financial leader, your role is to protect the firm's cash position. The AR turnover ratio is a direct measure of your credit-to-cash cycle's performance.
This isn't an abstract accounting concept; it's operational reality. A strong ratio means your collections process is effective, clients pay on time, and the firm operates without relying on external financing. It provides a clear view into your financial rhythm.
Visual Idea: A cinematic shot of a digital dashboard displaying a rising AR turnover ratio, with key metrics like DSO and cash flow improving in real-time.
Diagnosing Your Firm's Financial Cadence
A declining AR turnover ratio is an early warning system. It signals a breakdown in the credit-to-cash cycle, such as lax credit terms, slow invoicing, or inconsistent collections follow-up. This single metric enables you to:
- Improve cash flow by identifying and resolving collection bottlenecks.
- Reduce DSO (Days Sales Outstanding) by implementing more effective credit policies.
- Gain control over working capital and maintain liquidity.
For professional services firms, AR turnover reflects both client relationship health and process integrity. A stable or improving ratio demonstrates that operational and financial systems are aligned.
A consistently low ratio points to systemic issues. Perhaps client onboarding lacks clear payment expectations, or the team has no structured follow-up process. Without tracking this ratio, these problems can quietly erode your cash position.
This guide provides the framework to use the AR turnover ratio as a precise diagnostic tool, moving from reactive problem-solving to proactive financial strategy.
The Precise Formula for AR Turnover Calculation

Inaccurate data leads to flawed strategy. For the AR turnover ratio to be a useful diagnostic, the calculation must be precise. The formula is straightforward, but its components have nuances critical for professional services firms.
Here is the standard formula:
AR Turnover Ratio = Net Credit Sales / Average Accounts Receivable
This ratio reveals how many times your firm collected its average AR balance during the period. A higher number indicates greater efficiency in converting billings to cash.
Defining Net Credit Sales for Services
For a services firm, Net Credit Sales is not total revenue. It is the value of services billed on credit that you realistically expect to collect.
To calculate it, start with gross billings and subtract any adjustments. Our detailed guide explains how to calculate net credit sales, but the core components are:
- Gross Billings: The total amount invoiced to clients.
- Minus Adjustments: Credits issued, early payment discounts, and bad debt write-offs.
Using total revenue instead of net credit sales will artificially inflate your turnover ratio, masking collection issues and creating a false sense of security.
The table below breaks down each component to ensure accuracy.
AR Turnover Formula Components
Component | Definition for Professional Services | Common Pitfall |
|---|---|---|
Net Credit Sales | Total value of services invoiced on credit, minus returns, allowances, and discounts. It reflects expected collections. | Using total firm revenue instead of only sales made on credit. This inflates the numerator and distorts the ratio. |
Average AR | The average value of accounts receivable over a period, calculated as (Beginning AR + Ending AR) / 2. | Using only the ending AR balance. This fails to account for fluctuations and provides a skewed picture of the collection cycle. |
Accurate inputs are the foundation of a reliable analysis.
Calculating Average Accounts Receivable
The denominator, Average Accounts Receivable, smooths out fluctuations in your billing cycle. A single AR snapshot can be misleading, especially after billing large projects.
The calculation provides a more stable baseline:
Average AR = (Beginning AR + Ending AR) / 2
Select a consistent period, either quarterly or annually. While annual figures are standard for high-level reporting, quarterly calculations offer more timely operational insights, allowing for faster response to negative trends.
For example, a firm with annual credit sales of $5M, a beginning AR of $800K, and an ending AR of $950K would first calculate its average AR: ($800K + $950K) / 2 = $875K. The resulting turnover ratio is 5.71 ($5M / $875K). This means the firm collects its full AR balance 5.7 times per year, or every 64 days.
This solid foundation ensures the ratio accurately reflects your firm's financial health.
Putting the Formula to Work: A Real-World Example
Formulas are only valuable when applied to a business. Let's walk through a practical accounts receivable turnover calculation for a mid-market consulting firm to see how these numbers reveal cash collection efficiency.
Consider a firm with these annual financials:
- Net Credit Sales: $10,000,000
- Beginning Accounts Receivable (Jan 1): $1,500,000
- Ending Accounts Receivable (Dec 31): $2,100,000
For a growing firm, an increase in the ending AR balance is common, reflecting higher billing volume.
Step-by-Step Calculation
First, we calculate the firm's Average Accounts Receivable. This step is crucial for establishing a reliable baseline that smooths out cyclical variations.
- Calculate Average Accounts Receivable: ($1,500,000 + $2,100,000) / 2 = $1,800,000
With the average AR established, we can complete the turnover calculation.
- Calculate the AR Turnover Ratio: $10,000,000 (Net Credit Sales) / $1,800,000 (Average AR) = 5.56
The ratio of 5.56 means the firm collected its entire average AR balance approximately 5.6 times during the year. To make this metric actionable, we translate it into days.
From Turnover Ratio to Days Sales Outstanding (DSO)
Days Sales Outstanding (DSO) provides a clear, operational metric: the average number of days it takes to collect payment after invoicing.
DSO = 365 Days / AR Turnover Ratio
Let's calculate the DSO for our consulting firm:
365 / 5.56 = 65.6 Days
This firm waits, on average, nearly 66 days to convert its work into cash. If standard payment terms are Net 30, a 66-day DSO is a significant red flag. It indicates a disconnect between payment expectations and reality, which directly impacts the ability to improve cash flow.
Calculating AR turnover has been a staple in business for decades, moving from manual ledgers to integrated tools like QuickBooks AR automation. You can discover more insights on how this fundamental metric is used across industries.
For this consulting firm, a 66-day DSO is a call to action. It signals a need to examine invoicing, credit, and follow-up processes—areas where accounts receivable automation can drive significant improvement and help reduce DSO.
How to Interpret Your Firm's AR Turnover Ratio
You've calculated your AR turnover ratio. The number itself is just data; its value lies in interpretation. A high or low ratio signals the health of your credit policies, invoicing speed, and collections effectiveness.
For a professional services firm, a high ratio is a positive indicator. It suggests prompt invoicing, adherence to payment terms, and effective follow-up. A low ratio is a warning sign of invoicing delays, overly lenient credit terms, or an inconsistent collections process.
This flowchart shows how a firm with $10M in sales and a turnover ratio of 5 results in a 73-day collection cycle.
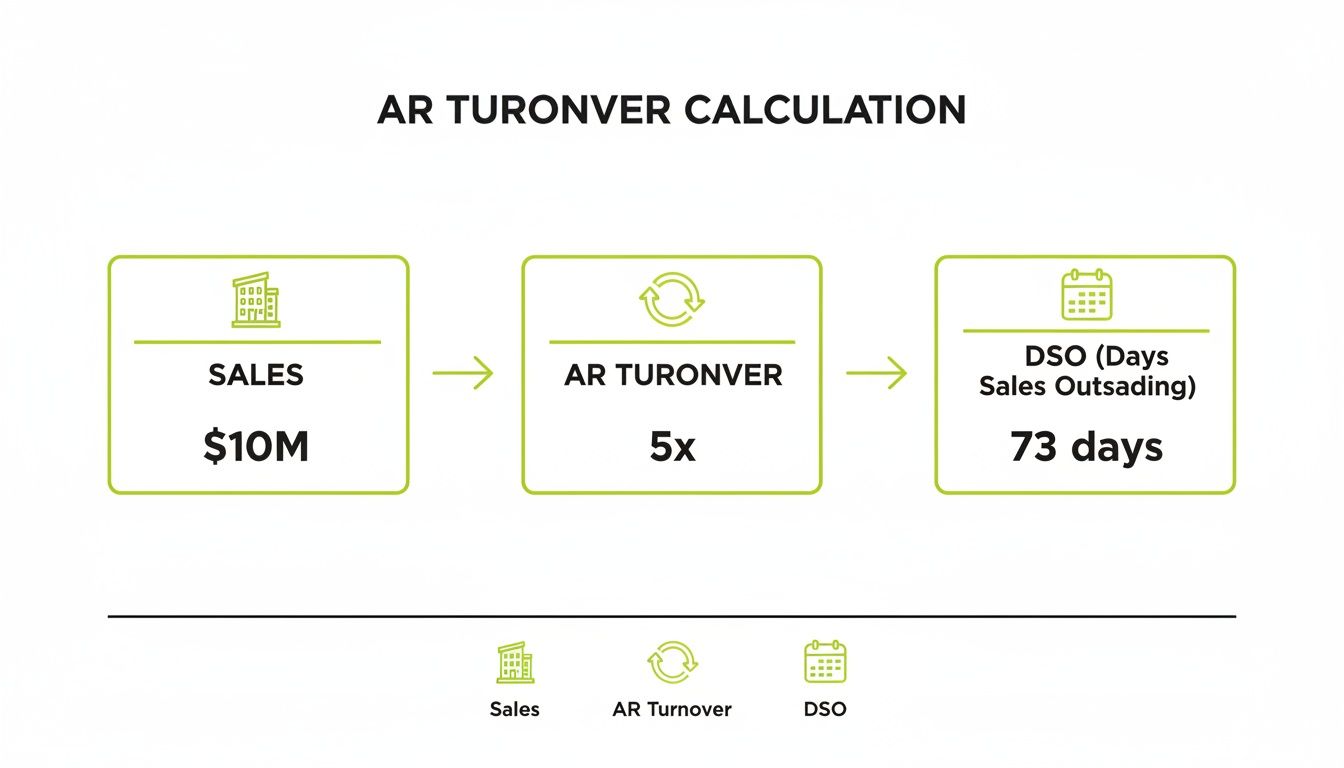
This visual connects the abstract turnover ratio to Days Sales Outstanding (DSO)—a tangible metric felt in daily operations.
Look at the Trend, Not Just the Snapshot
A single ratio is a point-in-time measurement. The true narrative emerges from tracking it over several periods. This trend acts as an early warning system, allowing you to identify issues before they become a cash flow crisis.
- An Improving Ratio: A clear win. Process changes are paying off, and you're converting work into cash faster.
- A Stagnant Ratio: May indicate solid but capped processes, or hidden issues preventing further improvement.
- A Declining Ratio: A call to action. It signals growing risk in your credit-to-cash cycle and often precedes a cash crunch. Investigate immediately.
The operational impact is significant. A firm with a receivable turnover of 4.8 times per year collects payments every 76 days on average. That cycle directly influences working capital and forecasting accuracy.
Is a Higher Ratio Always Better?
Pursuing the highest possible ratio can be a strategic error. An extremely high ratio may indicate that your credit policies are too restrictive, potentially turning away creditworthy clients and stifling growth.
A healthy AR turnover ratio balances efficient collections with a credit policy that supports sustainable growth. The goal is to enable the business, not just collect faster.
A low ratio is a direct drag on cash flow, tying up working capital in unpaid invoices. This is where AI AR automation can fundamentally change the dynamic, providing the systems to stabilize and improve your ratio without damaging client relationships.
By turning this metric into a strategic tool, you can get a real grip on your firm's financial health. For a closer look at a related metric, check out our guide on calculating the average collection period.
Actionable Strategies to Improve Your Turnover Ratio
Calculating the ratio is the first step. The real work is using that insight to drive meaningful change. A low or declining ratio is a clear signal that your credit-to-cash cycle requires optimization.
Improving your ratio requires a disciplined focus on the mechanics of your AR process. This means making practical, real-world adjustments that will measurably improve cash flow and reduce DSO.
Fortify Your Foundational AR Processes
Technology cannot fix a broken process. Begin by examining your core operations.
- Refine Credit Policies: Are credit terms clear and applied consistently? Minor adjustments can prevent high-risk accounts from becoming collection problems.
- Accelerate Invoicing: Delays in invoicing are self-inflicted. Invoices should be sent immediately upon project completion or milestone achievement, not batched at month-end.
- Systematize Follow-Up: Random follow-up yields random results. Implement a structured plan for reminders and collection calls to ensure consistent, professional communication.
Fixing these fundamentals creates a more disciplined collections environment. However, manual execution at scale is often the point of failure as team capacity becomes a bottleneck.
A well-defined manual process is better than an undefined one, but a well-orchestrated automated process delivers scalable control. The goal is to systematize efficiency, not just individual effort.
Amplify Your Efforts with AI AR Automation
This is where technology provides a decisive advantage. Modern AI AR automation platforms orchestrate the entire collections process with a precision and scale that a manual team cannot match.
AR software for professional services executes your defined policies flawlessly. It systematizes your collections strategy, ensuring every client receives the right communication at the right time. This has a direct and immediate impact on your ability to reduce DSO.
Platforms offering QuickBooks AR automation connect directly to your accounting system. They use real-time data to send personalized reminders, manage disputes, and provide clients with a simple online payment portal. Removing this friction accelerates payment.
The power of accounts receivable automation lies in its intelligence. These systems provide a live dashboard of your AR health, enabling proactive collections management and a measurable improvement in cash flow.
Moving from Calculation to Control with AR Automation

Improving your firm’s AR turnover is not about aggressive collections. It’s about building a consistent, intelligent system. True control comes from orchestrating the entire credit-to-cash cycle, not just analyzing metrics after the fact.
Modern AI AR automation provides a significant operational advantage. It integrates credit checks, collections reminders, and cash application, eliminating the manual friction that lowers your turnover ratio and inflates DSO.
An automated system delivers the right message to the right client at the right time. It escalates professionally without straining client relationships. This is why more financial leaders are seeing that accountants ditching spreadsheets for enhanced financial management is a move toward strategic control.
Visual Idea: A split-screen visual. On the left, a frustrated finance professional is buried in spreadsheets and manual emails. On the right, a calm CFO reviews a clean AR automation dashboard, making a strategic decision.
An optimized AR process transforms a financial metric from a historical report into a lever for future growth. Automation ensures this process runs consistently, turning your collections strategy into a predictable asset.
When a platform handles routine follow-ups, your team is free to focus on high-value activities like managing complex accounts or strategic financial planning. You can see how to automate accounts receivable and its real-world impact.
This isn't about replacing people; it’s about equipping them with a system that executes flawlessly. It is the final step in mastering your firm’s financial health and ensuring your accounts receivable turnover calculation reflects a strong, efficient operation.
Answering Your Top Questions
Finance operators need straight answers, not textbook definitions. Here are responses to common questions about the AR turnover ratio from professional services firms.
How Often Should We Be Calculating AR Turnover?
Annual calculation provides a historical snapshot, but the real value comes from more frequent analysis. Calculate it quarterly, or even monthly.
Frequent tracking transforms the ratio from a lagging indicator into a proactive management tool. You can identify a slowdown in client payments early and act before it impacts working capital.
What’s a Good AR Turnover Ratio for a Professional Services Firm?
There is no universal "good" number; it depends on your firm's standard payment terms. A higher ratio almost always indicates a more efficient collections process.
A solid benchmark is a ratio that brings your Days Sales Outstanding (DSO) in line with your payment terms. If your terms are Net 30, a DSO below 30 is a strong target. The most important factor is a consistent or improving trend over time.
Is It Possible for Our Turnover Ratio to Be Too High?
Yes. An exceptionally high AR turnover ratio can signal that your credit policies are too restrictive.
If you only extend credit to the most established clients, you are likely turning away good business and limiting growth.
The optimal state is a balance between efficient collections and a credit policy that enables you to win new clients. The goal is to improve cash flow without constricting your sales pipeline.
--- Resolut automates AR for professional services—consistent, accurate, and human. Find out more at https://www.resolutai.com.