
The Average Accounts Receivable Formula for Financial Control
Learn how to use the average accounts receivable formula to calculate, interpret, and improve your firm's cash flow and reduce DSO.
For leaders at professional services firms, cash flow is not an abstract concept—it is the operational lifeblood of the business. The average accounts receivable formula is a primary diagnostic tool for assessing its health.
This metric provides a clear, quantitative measure of the capital tied up in unpaid client invoices at any given time.
Why Average Accounts receivable Is a Foundational Metric
In professional services, your ability to forecast, invest, and scale is directly linked to the velocity of your cash conversion cycle. Calculating average accounts receivable is not a clerical task; it is a strategic imperative for optimizing working capital.
Think of it as a barometer for your collections process efficiency. A high or rising average AR balance signals potential issues: overly generous payment terms, an inefficient collections cycle, or deteriorating client credit quality.

The Quantifiable Cost of a Slow Collections Cycle
Your average accounts receivable directly informs Days Sales Outstanding (DSO), the precise measure of how long your firm waits for payment. This is a critical operational KPI.
Late payments are a systemic drag on capital. An estimated 81% of businesses report an increase in delayed payments, creating significant opportunity costs. That is capital that cannot be deployed for hiring, technology investments, or distributions.
Monitoring average AR enables three key outcomes:
- Improve Cash Flow: Isolate and address bottlenecks in the collections process to accelerate payment velocity. See our guide to small business cash flow management.
- Reduce DSO: Systematically managing your average AR is the most direct method for lowering Days Sales Outstanding.
- Enhance Financial Planning: Accurate AR data improves the reliability of cash forecasts, enabling more precise strategic decision-making.
Mastering this formula is about exercising financial control. It ensures the capital your firm has earned is working for the business, not sitting idle on a client's balance sheet.
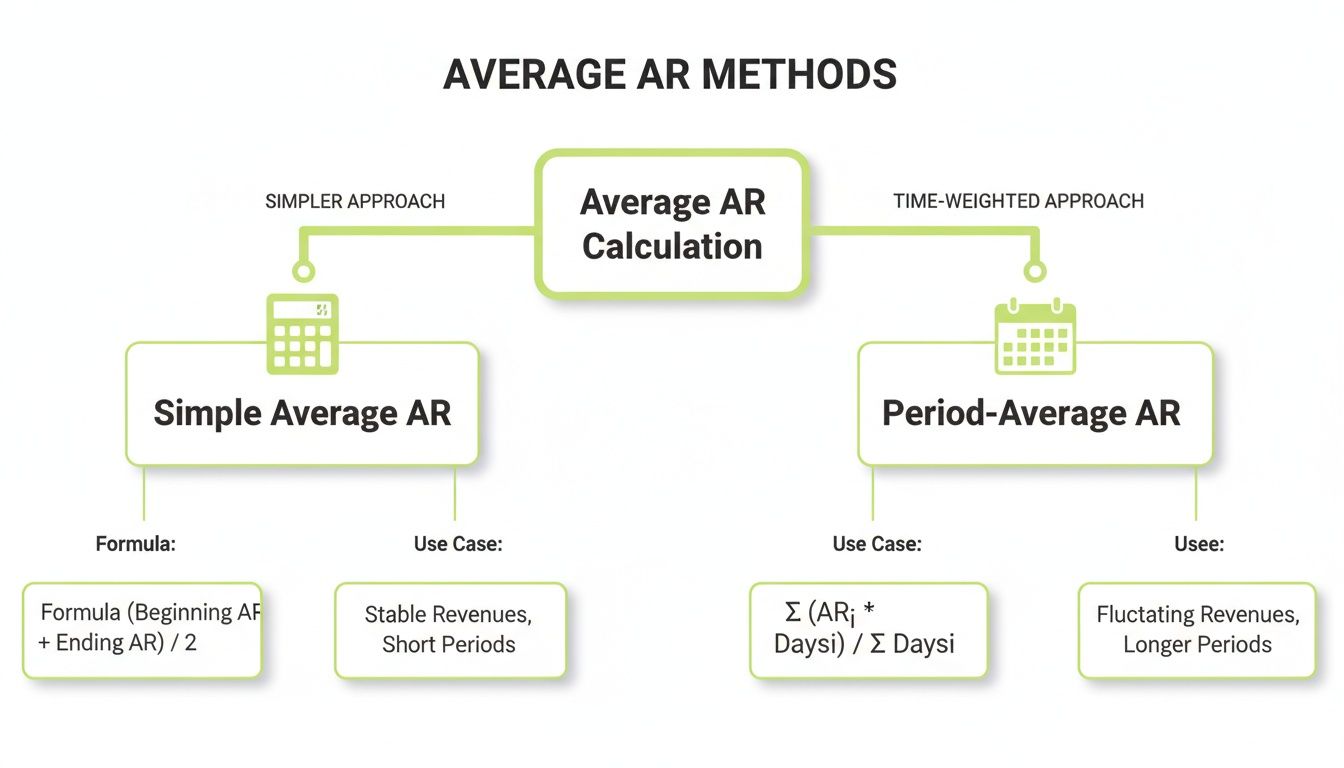
Two Methods for Calculating Average Accounts Receivable
Accurate financial metrics depend on selecting the appropriate formula for the operational reality of the business. An incorrect calculation can lead to flawed strategic conclusions.
This is particularly true for professional services firms, where revenue is often tied to project milestones or seasonal client demand, not a smooth, linear progression. Let's analyze the two standard methods.
Method 1: The Simple Average Formula
The simple average method is a straightforward calculation providing a high-level snapshot. It is adequate for firms with highly stable and predictable monthly revenue.
The calculation requires two data points: the accounts receivable balance at the beginning of a period and the balance at the end.
Formula:(Beginning AR Balance + Ending AR Balance) / 2
For a firm starting a quarter with $400,000 in receivables and ending with $500,000, the calculation is:
($400,000 + $500,000) / 2 = $450,000 Average AR
The primary drawback is its susceptibility to distortion. A single large invoice issued on the final day of a period can artificially inflate the average, misrepresenting the typical cash position.
Method 2: The Period-Average Formula
For firms with seasonal or project-based revenue fluctuations, the period-average method provides a more accurate and representative figure. It normalizes the impact of monthly volatility.
This method uses multiple data points, such as the AR balance at the end of each month within the period, to calculate a truer average. A disciplined approach to metrics is crucial; just as you track AR, understanding your firm's Average Order Value (AOV) provides a more complete financial picture.
Formula (for an annual period):(Sum of All 12 Month-End AR Balances) / 12
Consider the same quarter, but with monthly detail. Month-end balances are $400K (Jan), $650K (Feb), and $500K (Mar).
($400,000 + $650,000 + $500,000) / 3 = $516,667 Average AR
The resulting figure is higher, accurately reflecting the mid-quarter peak. This provides a more reliable basis for calculating DSO and AR turnover. QuickBooks AR automation tools excel here, performing these period-based calculations automatically and eliminating manual spreadsheet risk.
Comparing Average AR Calculation Methods
This comparison clarifies the appropriate use case for each method.
Method | Formula | Best For | Key Consideration |
|---|---|---|---|
Simple Average | (Beginning AR + Ending AR) / 2 | Quick, high-level analysis; businesses with stable, predictable revenue. | Can be skewed by large transactions at the beginning or end of the period. |
Period-Average | (Sum of Balances for Each Sub-Period) / Number of Sub-Periods | Businesses with seasonal or fluctuating revenue cycles requiring an accurate figure for strategic planning. | Requires more data points but provides a truer representation of the firm's AR position. |
For strategic decision-making, the period-average method is superior. The simple average is best reserved for high-level estimates where precision is not critical.
[VISUAL IDEA: A cinematic, high-contrast photo of a controller's desk at night, illuminated only by a monitor displaying a clean, modern AR dashboard with trend lines for DSO and Average AR. Focus is on the data.]
A Practical Walkthrough With Real-World Examples
Financial formulas are theoretical until applied to operational data. Let's model these calculations with scenarios common to a $10M professional services firm.
These examples illustrate how the choice of method impacts the understanding of the collections cycle and overall financial position.
Example 1: The Simple Average for a Stable Quarter
Consider a consulting firm with a consistent Q1. The period begins on January 1 with an accounts receivable balance of $750,000. On March 31, the balance is $850,000.
The simple average formula is sufficient here.
- Formula: (Beginning AR + Ending AR) / 2
- Calculation: ($750,000 + $850,000) / 2 = $800,000
The average accounts receivable for Q1 is $800,000. This provides a reliable baseline for reporting when revenue is stable.
Example 2: The Period-Average for a Volatile Year
Now consider a more typical scenario for a growing firm: a year where Q4 includes a significant increase in billings from year-end project completions. A simple average would misrepresent the annual AR position.
The year's month-end AR balances are as follows:
- Q1 Total: $2,400,000 (Avg $800k/month)
- Q2 Total: $2,700,000 (Avg $900k/month)
- Q3 Total: $3,000,000 (Avg $1M/month)
- Q4 Total: $4,800,000 (Avg $1.6M/month)
Using the period-average formula, we sum the monthly balances and divide by 12.
- Formula: (Sum of All Month-End Balances) / 12
- Calculation: ($2,400,000 + $2,700,000 + $3,000,000 + $4,800,000) / 12 = $12,900,000 / 12 = $1,075,000
The result, $1,075,000, is a truer representation of capital tied up in receivables. It correctly weights the Q4 increase, preventing the understatement of DSO. Achieving this precision is a core function of modern AR software for professional services.
The simple average is useful for a snapshot, but the period-average provides the precision required for rigorous financial planning, especially with non-linear revenue.
[VISUAL IDEA: A clean, minimalist line chart showing two lines over a 12-month period. One flat line represents the 'Simple Average' calculation. The other fluctuating line represents the monthly AR balances, with a third dotted line showing the more accurate 'Period-Average'.]
Connecting Average AR to DSO and Turnover Ratios
The calculation of average accounts receivable is not an end in itself. Its value is realized when used as an input for two critical performance metrics: Days Sales Outstanding (DSO) and the Accounts Receivable Turnover Ratio.
Think of average AR as a key variable. On its own, it is a static number. When integrated into these ratios, it produces actionable insights into financial performance.
Interpreting Your DSO
DSO measures the average number of days it takes for clients to pay their invoices. A lower DSO indicates higher cash velocity. Average AR is the primary driver of this calculation.
DSO Formula: (Average Accounts Receivable / Total Credit Sales) x Number of Days in Period
The relationship is direct: lowering your average AR will reduce your DSO. The impact is material. For a $10M firm, reducing DSO by just five days can unlock nearly $140,000 in working capital.
Assessing Collections Efficiency with AR Turnover
The AR Turnover Ratio measures the number of times a firm collects its average receivables balance over a period. It is an efficiency metric for the collections function. A higher ratio indicates a more effective process. You can get a more detailed breakdown by calculating your accounts receivable turnover.
AR Turnover Ratio Formula: Net Credit Sales / Average Accounts Receivable
A lower average AR results in a higher, healthier turnover ratio. It is a clear indicator of the firm's ability to convert revenue into cash. These are not static reporting numbers; they are active management tools.
Consistent tracking reveals patterns in client payment behavior and measures the effectiveness of credit and collections policies. This is where accounts receivable automation delivers significant value. It provides real-time KPI dashboards, replacing manual data compilation and enabling proactive intervention.
How AR Automation Delivers More Accurate and Actionable Metrics
Manual calculation of average accounts receivable in spreadsheets is inefficient and prone to error. A single formula mistake can corrupt cash flow forecasts and lead to poor strategic decisions. The process is inherently reactive, analyzing historical data long after the opportunity for intervention has passed.
This is a loss of control. When the finance team is occupied with data reconciliation, they cannot perform value-added analysis. The firm is forced to manage by looking at lagging indicators.

From Reactive Data to Proactive Control
Accounts receivable automation systems change this dynamic. By integrating directly with accounting platforms—such as with QuickBooks AR automation—they eliminate manual data entry. This creates a single source of truth for calculating average AR, DSO, and turnover ratios in real time.
The true value is converting these metrics into action. An AI AR automation platform transforms the average AR calculation from a historical figure into a trigger for intelligent collection workflows.
- Real-Time Dashboards: Leadership has an immediate, clear view of cash flow trends and at-risk invoices.
- Predictive Analytics: The system flags accounts with a high probability of late payment, enabling proactive outreach.
- Automated Workflows: The platform initiates customized reminder sequences based on real-time data, escalating as needed.
This impact is driving market growth. An accounts receivable automation market report finds that 80% of users report significant efficiency gains.
Unlocking True Operational Insight
With accurate, real-time metrics, the focus shifts from measurement to active management. The strategic question becomes, "Which clients are negatively impacting DSO, and what is our intervention plan?" To see how this works, learn more about how to automate accounts receivable.
This level of control enables a deliberate strategy to reduce DSO. It provides the clarity to make financial decisions with confidence, based on precise, current data tied directly to actions that improve cash flow.
Moving from Measurement to Management
Calculating your average accounts receivable is the starting point. The objective is to move from measurement to active management—to use this metric to drive operational changes that strengthen the firm's financial position.
The average accounts receivable formula is a diagnostic tool. When connected to KPIs like DSO and turnover, it becomes a powerful lever to directly improve cash flow.
Turning Insight into Operational Control
Effective Accounts Receivable Management is a system, not a quarterly calculation. It requires three integrated components:
- Accurate Calculation: Use the period-average method for a true representation of the firm's AR position.
- KPI Connection: Link average AR directly to performance metrics like DSO to measure what matters.
- Strategic Automation: Employ tools that provide real-time data visibility and enable immediate action.
The urgency is clear. With rising interest rates and liquidity constraints, the cost of carrying receivables is increasing. Accounts receivable automation provides a solution.
Data from recent accounts receivable automation market analyses shows that firms using these systems see 25% fewer outstanding invoices. By combining a rigorous understanding of the formula with modern tools, finance leaders gain the control to transform AR from a cost center into a predictable cash engine.
This is about building a system for predictable cash flow and enabling smart, stable growth.
--- Resolut automates AR for professional services—consistent, accurate, and human.