How to Calculate Average Accounts Receivable and Improve Cash Flow
Learn how to calculate average accounts receivable to reduce DSO and improve cash flow. A guide for CFOs and controllers at professional services firms.
Calculating average accounts receivable—beginning plus ending AR, divided by two—is simple. But viewing it as just a formula misses the point. The metric's real value lies in smoothing out billing cycle volatility to provide a stable view of capital tied up in unpaid invoices.
This clarity is the first step toward operational control.
A Finance Operator's View on Average Accounts Receivable
For CFOs and controllers at professional services firms, average accounts receivable is more than an accounting entry. It is a direct measure of operational efficiency—how effectively your firm converts billable work into cash.

This figure is the foundation for calculating Days Sales Outstanding (DSO) and a core input for your cash conversion cycle. A high or rising average AR indicates significant working capital is trapped on the balance sheet, unavailable for operations or investment.
Why This Metric Demands Attention
Mastering your average AR is the first step to diagnosing friction in your revenue cycle. For firms in the $3M–$50M range, even minor improvements in collection times materially impact liquidity. A persistently high average AR often signals deeper operational issues.
What might it be indicating?
- Process delays: Lag time between service delivery, invoicing, and follow-up can significantly extend payment cycles.
- Inconsistent credit policies: Your firm may be offering overly generous terms or failing to enforce existing policies consistently across all clients.
- Shifts in client financial health: A rising AR can be an early indicator that your clients are facing their own cash flow constraints.
Your average AR is a direct reflection of your firm's operational discipline and the health of your client payment behaviors. It’s a measure of control.
Conversely, a stable or declining average AR signals strong operational command. It demonstrates prompt invoicing, disciplined credit management, and predictable collections—the foundation for accurate cash flow forecasting and confident capital allocation.
This guide moves beyond the basic calculation. We will analyze what the metric reveals, avoid common measurement errors, and leverage tools like accounts receivable automation to systematically lower the number, improve cash flow, and build a more resilient financial base.
How to Calculate Average AR and DSO Using Real-World Numbers
Let's move from theory to application. Calculating your average accounts receivable provides the baseline for understanding how efficiently your firm converts invoices into cash. It starts with two core formulas.

First, the formula for Average Accounts Receivable:
(Beginning AR + Ending AR) / 2
This simple average smooths out fluctuations from irregular billing cycles or large, one-off project invoices. It provides a more stable and reliable measure than a point-in-time balance sheet figure.
With that average, you can calculate a more powerful metric: Days Sales Outstanding (DSO).
(Average AR / Total Credit Sales) x Number of Days in Period
DSO translates your average AR into the number of days it takes to collect payment. This metric reveals the velocity of your cash conversion cycle.
A Practical Example: A $10M Consulting Firm
Let's apply this to a $10M consulting firm analyzing its performance for March.
Here are the inputs:
- Beginning AR (March 1): $1,200,000
- Ending AR (March 31): $1,400,000
- Total Credit Sales for March: $833,333 ($10M / 12 months)
- Number of Days: 31
First, calculate the average AR for the month:
($1,200,000 + $1,400,000) / 2 = **$1,300,000**
With the average AR, we can now determine DSO:
($1,300,000 / $833,333) x 31 = **48.3 Days**
The result is clear: in March, it took this firm an average of 48 days to collect cash after billing for services. This represents a significant drag on working capital.
Getting this calculation right is more critical than ever. In early 2024, global working capital hit its highest level since 2008. For US firms, this meant an estimated $1.7 trillion in excess working capital was stuck in operations instead of being put to better use.
While monthly calculation is useful for operational control, a quarterly view provides a clearer trend by smoothing single-month anomalies.
For firms with highly variable sales, a simple average may not suffice. You may need to learn how to calculate weighted averages in Excel for a more precise result. For an even more precise view of collections, you might also want to read about our guide on the Days Sales Uncollected formula.
Sample Monthly Average AR and DSO Calculation
Here’s a breakdown for a professional services firm with monthly credit sales of $500,000.
Metric | Value | Formula / Note |
|---|---|---|
Beginning AR | $750,000 | AR balance on the first day of the month. |
Ending AR | $850,000 | AR balance on the last day of the month. |
Total Credit Sales | $500,000 | Total value of invoices issued during the month. |
Days in Period | 30 | Assuming a 30-day month (e.g., April). |
Average AR | $800,000 | |
DSO | 48 Days | |
As shown, despite strong sales, a high average AR results in a 48-day DSO, tying up cash needed for operations and growth.
What Your Average AR Is Actually Telling You
You've calculated your average accounts receivable. The real work is interpreting what the number means. This figure provides a clean, smoothed-out view of your cash position, cutting through the noise of monthly billing cycles.
A rising average AR is a clear warning. It can signal overly generous credit terms or a decline in clients' financial stability. Most often, however, it points to internal bottlenecks in your invoicing and collections process. A slow, upward creep is often the first symptom of loosening operational discipline.
Conversely, a steady or falling average AR signals control. It shows your processes are tight and your cash flow is predictable. This is the bedrock of confident financial leadership.
Benchmarking Performance for True Insight
Context is critical. A 48-day DSO might be acceptable in one industry but a major issue in another. Your most important benchmark is your own historical performance. The primary goal should be a consistent, downward trend in both average AR and the resulting DSO.
This requires tracking these metrics methodically—monthly and quarterly. When plotted on a chart, trends become impossible to ignore. A line chart showing your firm's DSO over 12 months, compared against a 45-day industry benchmark, provides an immediate, data-backed call to action for any period you exceed the benchmark.
Your average AR is a direct reflection of your firm's client relationships and operational discipline. It's a number that measures how effectively you turn billable hours into cash.
The current B2B payment landscape makes this discipline more critical than ever. Recent analysis shows over 50% of B2B invoices in major economies are paid late. In the US, 39% of B2B invoices are overdue, with 81% of businesses reporting that these delays are worsening.
Connecting AR to Your Firm's Health
A high average AR balance is not just an accounting issue; it directly impacts your ability to operate. That is cash that should be available to cover payroll, invest in technology, or fund strategic initiatives. For a deeper dive into collection efficiency, review how to calculate your accounts receivable turnover ratio.
Ultimately, a lower average AR means a stronger, more resilient firm. It’s a direct lever you can pull to improve cash flow.
Common Mistakes That Undermine AR Analysis
I’ve seen firms with the right formulas remain blind to a looming cash flow crisis. Correct calculation of average accounts receivable is just the starting point. The real pitfall is not in the math, but in the data and its interpretation.
One of the most common errors is including cash sales or upfront retainers in the Total Credit Sales figure used for DSO calculation. This mistake artificially deflates your DSO, creating a false picture of collection efficiency.
Another frequent mistake is inconsistent period comparison. Measuring one month's performance against a quarterly average yields no meaningful insight. Bad data leads to bad decisions.
The Biggest Blind Spot: The Aggregate Average
The most significant strategic error is relying solely on a single, top-line average AR number. A "healthy" aggregate figure can easily mask a growing concentration of aged, high-risk debt that is quietly eroding your liquidity. This is a classic case of a vanity metric creating a false sense of security.
Relying solely on a single average AR number is like flying a plane using only the altitude gauge. It tells you how high you are, but nothing about your speed, direction, or the mountains dead ahead.
True control comes from segmentation. You must break down your accounts receivable to get an honest, actionable view of where your capital is truly trapped.
How to Get an Honest Look at Your AR
Instead of focusing on one number, dissect your AR across several key dimensions.
- By Client: Start here. You will quickly identify which clients consistently pay late. This is not about blame; it is about identifying who may require different payment terms or a more proactive collections strategy.
- By Service Line: Do certain project types consistently have longer payment cycles? This insight can inform how you structure future contracts or price those services.
- By Invoice Age: This is non-negotiable. An AR aging report is your most critical tool. It shows you exactly where cash is trapped—in the 31-60 day bucket, or more critically, in the 90+ day column.
Consider two firms, both with an average AR that yields a 45-day DSO. On paper, they appear identical. Firm A's receivables are evenly distributed by age. Firm B has a large concentration of its AR in invoices over 90 days past due. Firm B is facing a liquidity crisis, even though its top-line metric looks acceptable.
This is the clarity that segmentation provides. It is the only way to truly begin to reduce DSO and take back control of your cash flow.
Using AR Automation to Systematically Lower Your Average AR
Knowing your average accounts receivable is diagnostic; actively reducing it is strategic. Once you have segmented your AR to identify where cash is trapped, the next step is implementing a system to get ahead of the problem. This means shifting from reactive collections to intelligent orchestration.
Modern AR software for professional services is more than a reminder tool. It is a collections system operating continuously in the background, upgrading how you manage cash flow.
The process is built on core disciplines that automation enforces.
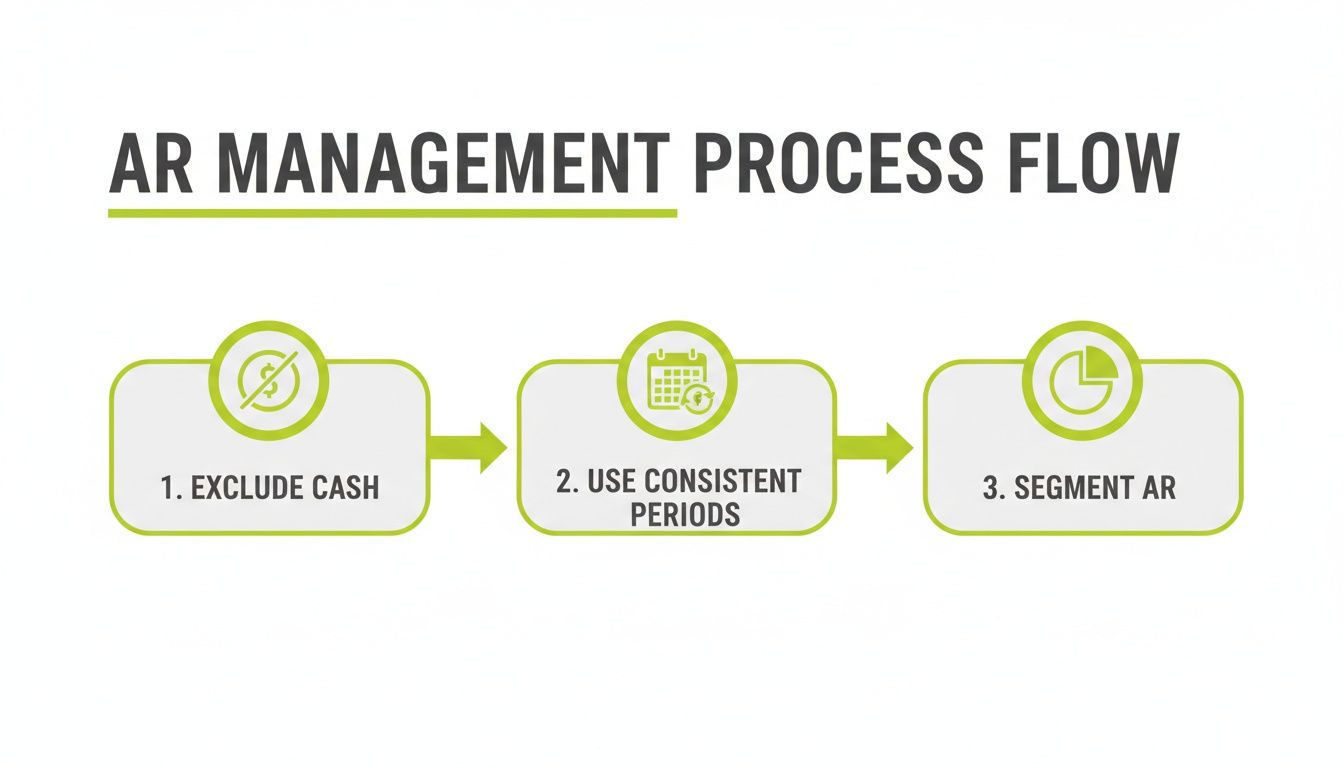
These principles—clean data, consistent periods, and segmentation—are foundational. Automation executes this strategy flawlessly, every time.
From Manual Effort to Intelligent Orchestration
Imagine your collections outreach is no longer a manual, one-size-fits-all task. Instead, a system driven by AI AR automation tailors communication based on client payment history and invoice risk.
A high-value client who consistently pays on time receives a polite, professional reminder before an invoice is due. An account with a history of paying 30 days late receives a more assertive, frequent follow-up cadence. This is about precision, not aggression.
This tailored communication preserves client relationships while accelerating payment. The impact on your balance sheet is direct and measurable.
For a $10M firm, reducing Days Sales Outstanding (DSO) from 45 to 30 days frees up over $400,000 in working capital. This is not an abstract accounting gain; it is cash available for hiring, investment, or strengthening reserves.
This is the outcome when AR shifts from a manual cost center to a data-driven, strategic function.
Key Features That Directly Lower Average AR
The right platform uses specific features to attack a high average AR. These tools remove friction from the payment process for both your clients and your team.
- Customer-Facing Payment Portals: A secure online portal allows clients to view all invoices and pay instantly via credit card or ACH. Removing the friction of printing a check or making a phone call can accelerate payment significantly.
- Automated Cash Application: Manually matching payments to invoices is a major time sink, especially in systems like QuickBooks. QuickBooks AR automation can reconcile payments automatically, ensuring your AR aging report is always accurate.
- Predictive Risk Alerts: An intelligent system can analyze payment patterns and flag at-risk accounts before they become seriously delinquent, allowing your team to intervene when the probability of collection is highest.
A System That Scales with Your Firm
The goal is not to replace your finance team but to amplify their effectiveness. A modern automation platform handles repetitive tasks, freeing skilled personnel to focus on high-value work: financial analysis, strategic planning, and client relationship management.
By automating the collections workflow, you build a system that is consistent, accurate, and scalable. This is critical, as manual processes that work for a small firm inevitably fail under increased volume. You can learn more about how to automate accounts receivable in our detailed guide.
This systematic approach directly addresses the root causes of high average AR, allowing you to methodically reduce DSO and improve cash flow.
Frequently Asked Questions
Knowing the formula for average accounts receivable is just the beginning. Here are common questions from finance leaders and the practical answers needed to put this metric to work.
How Often Should We Calculate Average Accounts Receivable?
For operational control, calculate this metric monthly. A monthly calculation provides a timely signal on collections performance, helping you identify negative trends before they escalate.
Quarterly calculations serve a strategic purpose, ideal for board reporting and high-level analysis as they smooth out monthly volatility. Relying solely on quarterly or annual figures is a mistake; you can miss serious cash flow issues developing beneath the surface.
Can I Calculate This Metric in QuickBooks?
Yes, but it is a manual process. Accounting software like QuickBooks can provide the AR Aging reports needed to find your beginning and ending AR balances.
The limitation is that these systems do not have a built-in function to calculate average accounts receivable or the resulting DSO. You must export the data to a spreadsheet for the final calculation. The alternative is dedicated AR software for professional services, like Resolut, which tracks these KPIs on a live dashboard, removing manual work and the risk of spreadsheet errors.
The real risk of manual calculation isn't just the time it takes—it's the errors. One broken formula in a spreadsheet can give you a completely false sense of security about your cash position for an entire quarter.
What Is a Good DSO for a Professional Services Firm?
While this varies by specialty, a DSO below 45 days is a healthy target for most professional services firms. Achieving a DSO below 30 days indicates excellent operational control.
However, your most important benchmark is your own trend line. A consistently rising DSO is a major red flag, even if the absolute number remains within an "acceptable" range. Your primary goal should always be steady, incremental reduction.
How Does Automation Improve Calculation Accuracy?
Accounts receivable automation improves accuracy by eliminating human error and data latency. An AI AR automation tool connects directly to your general ledger, keeping all data synchronized in real time.
For example, automated cash application matches payments to invoices instantly. This provides a continuously updated ending AR balance. When you calculate average accounts receivable, you are using precise, current data, not figures from last week's manual spreadsheet update.
--- Resolut automates AR for professional services—consistent, accurate, and human.