How to Calculate Accounts Receivable: A CFO’s Guide to Cash Flow Control
Learn how to calculate accounts receivable and optimize cash flow with practical formulas and automation.
For finance leaders at professional services firms, mastering accounts receivable isn't an accounting chore—it's an exercise in control. Inefficient AR means working capital is left on the table, cash that should be funding growth.
The entire collections process hinges on a few key metrics. The most critical is the AR Turnover Ratio (Net Credit Sales / Average Accounts Receivable). It tells you exactly how efficiently your firm converts invoices into cash.
Why Inefficient AR Calculation Is Costing Your Firm
Think of accounts receivable as the engine of your working capital. When AR processes are manual and inconsistent, they create a drag on operations and inject uncertainty into financial planning.
This is more than a few late payments. It's the compounding cost of delayed cash flow, administrative overhead, and missed opportunities to reinvest in the firm.

For professional services firms in the $3M to $50M revenue range, the stakes are high. Poor AR management directly impacts your ability to make payroll, hire talent, or expand service lines. The problem is rooted in manual processes that no longer scale.
The True Cost of Manual AR Processes
Managing AR with spreadsheets and manual follow-ups is unsustainable. It quietly erodes profitability through hidden costs you may not be tracking.
I see these costs manifest in four key areas:
- Bloated Labor Costs: Your finance team is consumed by data entry, payment matching, and reminder calls instead of focusing on high-value strategic analysis.
- Costly Human Errors: Manual data entry and spreadsheet formulas lead to unreliable cash forecasts and decisions based on faulty information.
- Strained Client Relationships: Inconsistent or impersonal collections can damage the goodwill you’ve worked to build with key clients.
- Chronic Cash Flow Delays: Without a systematic process, invoices sit unpaid. This is an operational bottleneck that stalls growth.
A firm with $10 million in annual revenue and a 60-day average collection period (DSO) has approximately $1.64 million tied up in receivables. Reducing DSO by just 10 days frees up over $270,000 in cash.
This isn't hypothetical. The knock-on effects are real. As firm efficiency drops, the AR turnover ratio falls and the cash conversion cycle lengthens. This is why accurate AR calculation is a strategic imperative.
The Financial Impact of an Inaccurate DSO
The performance gap between top-quartile firms and the median is staggering. U.S. businesses currently have a collective $600 billion in excess working capital trapped in receivables. This is largely driven by an 18-day gap in Days Sales Outstanding (DSO) between the best performers and the average.
The accounts receivable automation market is projected to grow from $4.2 billion to $10.1 billion by 2032, reflecting the value firms are unlocking. You can explore the full findings on the accounts receivable automation market. For a services firm, that 18-day lag is a direct opportunity cost.
The goal is to shift from reactive collections to proactive financial management. By learning how to calculate accounts receivable metrics accurately, you gain the visibility to optimize cash flow and reduce DSO.
This precision is the prerequisite for implementing systems like AI AR automation or QuickBooks AR automation that produce measurable results and improve cash flow.
Calculating Your AR Balance and Turnover Ratio
For any finance leader, two numbers tell the story of your collections health: the total Accounts Receivable (AR) balance and the AR Turnover Ratio. Getting these right is how you build a reliable gauge for your firm’s cash flow.
It starts with clean data from your general ledger. The old "garbage in, garbage out" adage is especially true here. Sloppy data leads to flawed metrics and poor decisions that hamstring your firm.
Establishing the Foundational AR Balance
First, you need your ending AR balance. This number shows precisely how much cash is locked in unpaid invoices at a specific point in time. It's a snapshot, but a critical one.
The formula is simple, but each component must be accurate.
Ending AR Balance = Beginning AR + Net Credit Sales – Cash Collected
Here’s the breakdown:
- Beginning AR: Your ending AR balance from the prior period (month or quarter).
- Net Credit Sales: Revenue from credit-based sales during the period, minus any credits or write-offs.
- Cash Collected: Total cash received from clients during the period, regardless of when the invoice was sent.
Let's use a real-world example: a $10M consulting firm analyzing its Q1 performance.
- Beginning AR (Start of Q1): $450,000
- Net Credit Sales (Invoiced in Q1): $2,500,000
- Cash Collected (Received in Q1): $2,300,000
Plugging those numbers in: $450,000 + $2,500,000 - $2,300,000 = $650,000.
The firm ended Q1 with $650,000 in outstanding receivables. That number is important for the balance sheet, but on its own, it lacks context. To understand performance, you must measure collection efficiency.
Visual Idea: A cinematic shot over the shoulder of a CFO looking at a clean, minimalist dashboard. The main KPI is "Cash Freed," showing a real-time dollar amount increasing as DSO decreases.
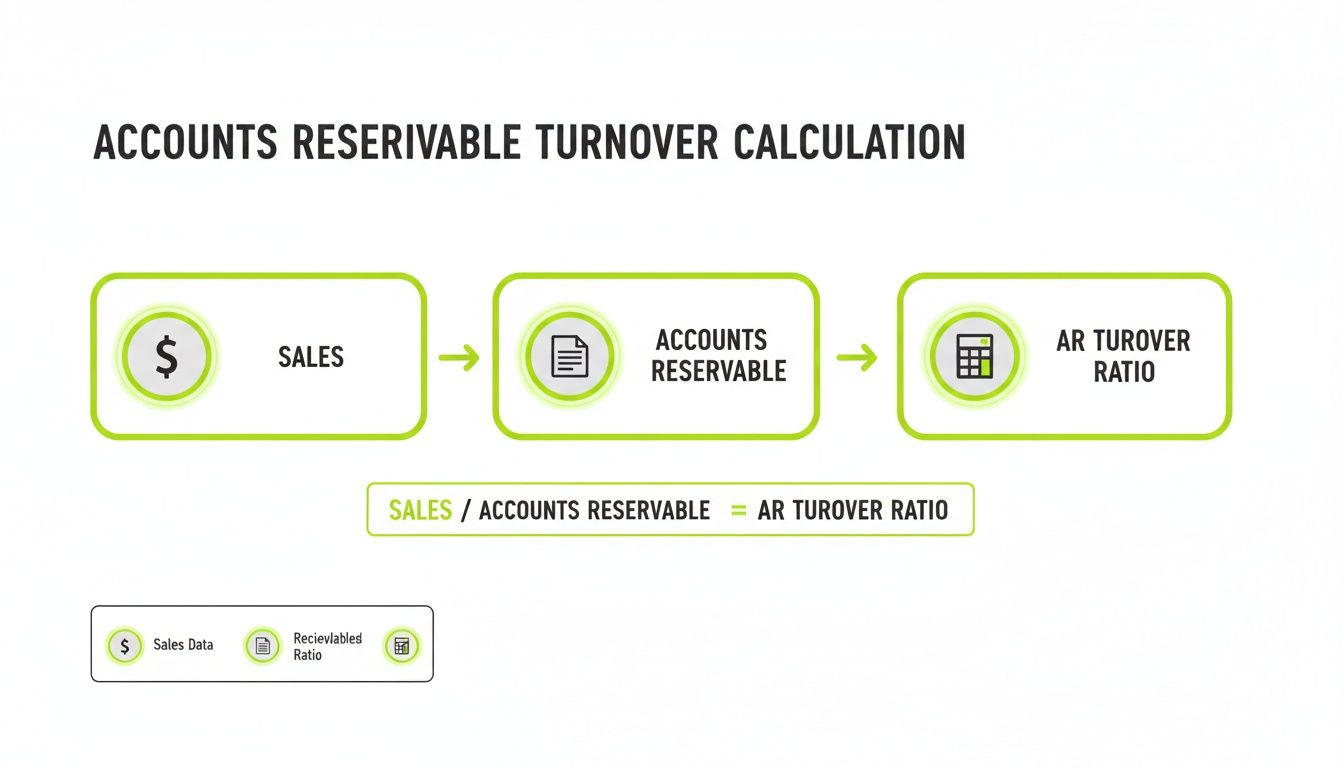
Measuring Collection Efficiency with the AR Turnover Ratio
This is where true insight comes from. The AR Turnover Ratio measures how many times you collect your average receivable balance during a period. A higher ratio signals an effective collections process and healthy liquidity.
The formula is: AR Turnover Ratio = Net Credit Sales / Average Accounts Receivable
To get your Average Accounts Receivable: (Beginning AR + Ending AR) / 2
Let's return to our $10M firm and calculate its AR Turnover Ratio for Q1.
First, we need the average AR. The beginning balance was $450,000 and the ending balance was $650,000.
- Average AR = ($450,000 + $650,000) / 2 = $550,000.
Next, with $2,500,000 in quarterly net credit sales, the ratio calculation is:
- $2,500,000 / $550,000 = 4.55
This means the firm collected its average receivables balance approximately 4.5 times during the quarter. This is a powerful KPI, especially when tracked over time. A declining ratio is an early warning that collections are slowing.
For a deeper dive, our guide on calculating accounts receivable turnover unpacks what this number reveals about your financial operations.
Knowing how to calculate accounts receivable is the starting point. The real value comes from using this data to accelerate your cash conversion cycle. This is where tools for accounts receivable automation can transform your finance function.
Using an AR Aging Report to Manage Risk
The AR aging report is your firm's financial early-warning system. It's more than a list of overdue invoices; it's a dynamic tool for managing risk.
A well-structured aging schedule segments receivables into time-based buckets: Current, 1-30 days, 31-60 days, 61-90 days, and 91+ days past due. This segmentation brings the data to life.
From Report to Predictive Tool
An aging report’s true value is predictive. When balances move from the 30-day bucket into the 60- or 90-day columns, you are watching potential write-offs form in real time.
For a professional services firm, where each invoice represents hours of valuable expertise, aging receivables are equivalent to revenue erosion.
The goal is to catch these issues before they become crises. A clean aging report helps pinpoint chronically slow payers or stalled invoices, allowing your team to focus its energy where the risk is highest.
By proactively managing your aging report, you’re not just chasing debt; you’re defending your firm's profitability. An invoice that moves from the 31-60 day bucket to the 91+ day bucket doesn't just represent a delay—it represents a significant increase in the probability of non-payment.
This detailed view also informs another key metric. Beyond the outstanding balance, you need to understand your accounts receivable turnover to gauge collection efficiency. An aging report shows why your turnover might be slipping by highlighting the accounts dragging down performance.
The higher the ratio of sales to receivables, the faster you're turning invoices back into cash.
Calculating the Allowance for Doubtful Accounts
Your AR aging report is the foundation for calculating the Allowance for Doubtful Accounts. This contra-asset account provides a realistic picture of what your receivables are actually worth.
It works by assigning a risk percentage to each aging bucket based on historical non-payment likelihood. This is a calculated provision, not a guess. A typical risk profile might look like this:
- Current: 0.5%
- 1-30 Days: 2%
- 31-60 Days: 5%
- 61-90 Days: 15%
- 91+ Days: 30% or more
These percentages vary by firm and industry, but the principle is constant: the older the debt, the higher the risk.
The calculation is straightforward: multiply the total balance in each bucket by its risk percentage. The sum is your total Allowance for Doubtful Accounts, which is then subtracted from gross receivables for a more accurate net value.
A Practical Example of Risk Provisioning
Let's apply this to a firm with a $5 million AR portfolio. In Q1, you observe that $500,000 of total AR is in the 91+ day bucket. Based on historical data, you assign a 30% "doubtful" rate.
That's a $150,000 provision from that aging bucket alone ($500,000 x 30%). Repeat this for every bucket to arrive at the total allowance.
This process does more than ensure GAAP compliance. It forces a data-driven conversation about risk, creating a clear incentive to take action—whether tightening credit policies or implementing accounts receivable automation.
How to Pinpoint Your Collection Speed with DSO
While AR turnover and aging reports diagnose issues, Days Sales Outstanding (DSO) measures your collection speed. It answers the critical question: "On average, how many days does it take us to get paid?"
For a professional services firm, this number dictates daily cash management.
A high DSO acts as a brake on your firm's financial engine, squeezing cash flow. A low DSO signals control and a healthy cash conversion cycle. Tracking DSO provides a powerful tool to forecast cash and set performance goals for your team.
Getting the DSO Calculation Right
The basic formula for DSO is simple, but a common error can render it misleading. Using total sales instead of net credit sales inflates the denominator and artificially lowers DSO, masking serious collection issues.
To get an accurate picture, you must use net credit sales.
DSO = (Average Accounts Receivable / Net Credit Sales) x Number of Days in Period
Let's break down the components:
- Average Accounts Receivable: Use the same figure from your turnover ratio: (Beginning AR + Ending AR) / 2. This smooths out anomalies.
- Net Credit Sales: Isolate revenue generated on credit terms for the specific period, excluding cash sales, returns, and allowances.
- Number of Days: Match this to the period you're analyzing (90 for a quarter, 365 for a year).
Sticking to this formula measures the true speed of your collections process.
A Practical Example of Calculating DSO
Let's calculate the DSO for our $10M consulting firm for Q1. We already have the necessary numbers:
- Average AR for Q1: $550,000
- Net Credit Sales for Q1: $2,500,000
- Number of Days in Q1: 90
Plug them into the formula:
DSO = ($550,000 / $2,500,000) x 90 = 79.2 days
It takes this firm an average of 79 days to get paid. If their payment terms are Net 30, this points to a major operational gap and a serious strain on cash flow. To learn more, see our guide on **what DSO means for your business**.
Days Sales Outstanding (DSO) pinpoints AR efficiency using the formula: DSO = (Average AR / Net Credit Sales) x 365. The Hackett Group's 2026 survey flags a significant 18-day DSO gap, which costs businesses $600 billion in excess working capital, with the overall cash conversion cycle at 37 days. Top firms achieve a DSO in the low-30s, while median companies lag far behind, showing how critical this performance indicator is. Find out more from The Hackett Group's survey on working capital.
From Metric to Action Plan
Knowing your DSO isn't enough. The power comes from using it to drive improvement. If that firm could cut its DSO from 79 down to 60 days, it would unlock approximately $520,000 in working capital.
That is cash that can be used to hire talent, invest in technology, or fund growth without debt.
This is where the focus shifts from calculation to active management. By implementing accounts receivable automation, you systematically address the root causes of high DSO. Tools like AI AR automation and integrated QuickBooks AR automation can:
- Automatically send personalized, timely payment reminders.
- Flag at-risk invoices before they become problematic.
- Offer clients simple digital payment options to accelerate cash receipt.
This turns DSO from a historical metric into a dynamic tool for improving your firm’s financial health.
Moving from Calculation to Control with AR Automation
Knowing your AR metrics like DSO and turnover is the starting point. It provides a snapshot of collections performance. But for any CFO or Controller, real financial control comes from acting on that data systematically.
This is where many professional services firms get stuck, chained to manual processes that create a gap between knowing the numbers and acting on them. The hidden costs are significant, from human error to the opportunity cost of misallocated team focus.

The leap from manual calculation to automated control separates a modern finance function from a legacy one. This principle is seen across sectors, such as with automation in the banking industry. The goal is to deploy technology to execute on the insights your calculations provide.
The Limits of Manual AR Management
Even with flawless calculations, a manual AR process is inherently reactive. A team member reviews an aging report, spots overdue invoices, and begins making calls or sending emails. The approach is slow, inconsistent, and unscalable.
This manual friction creates several problems:
- Delayed Action: Manual reviews are periodic. An invoice can age from 30 to 45 days overdue before anyone flags it.
- Inconsistent Communication: The tone and timing of reminders vary by team member, creating a disjointed client experience.
- No Data-Driven Prioritization: Teams chase the largest or oldest invoices, an instinct that ignores more telling risk factors like payment history.
- No Real-Time Visibility: By the time a spreadsheet report is circulated, the data is already stale.
This operational drag directly inflates your DSO. For a $15M firm with a DSO of 60 days, that’s roughly $2.5 million in cash tied up. Chipping away at that number manually is an uphill battle.
How Accounts Receivable Automation Closes the Loop
Accounts receivable automation platforms change the game. They build an operational engine that acts on financial data in real time, turning collections into a strategic, data-driven function.
Modern AI AR automation tools, including platforms offering QuickBooks AR automation, connect directly to your accounting system. They calculate AR metrics continuously and present them on a live dashboard.
Here’s the critical difference: Manual processes calculate metrics for later review. Automation uses those same metrics to drive action continuously. The question shifts from, "What's our DSO?" to "What are we doing right now to lower our DSO?"
This shift frees your finance team to focus on high-impact strategic work: financial planning, cash flow analysis, and managing key client relationships.
Measurable Outcomes from Automated AR Control
The goal of AR software for professional services is not to replace your team, but to give them superpowers of precision and scale. A good platform delivers tangible results across the collections cycle.
1. Proactive Risk Identification Instead of waiting for an invoice to hit the 90-day column, AI-driven systems use predictive analytics to flag at-risk accounts early. The platform can analyze payment patterns and client behavior to assign a risk score, allowing your team to intervene before a delay becomes a write-off.
2. Personalized and Persistent Outreach Automation enables personalized follow-up at a scale impossible to achieve manually. Smart workflows can change communication style based on client tier, invoice age, or risk profile. A high-value client receives a gentle reminder; a chronically late payer gets a more direct message.
3. Reduced Days Sales Outstanding (DSO) This is the ultimate outcome. By ensuring consistent follow-up and offering clients easy online payment options, automation directly accelerates your cash flow. Firms implementing AR automation often see a 10-25% reduction in DSO within months. Learn more in our guide on how to automate accounts receivable.
By moving from manual calculation to automated control, you gain predictability over your firm's most critical asset: cash. The conversation shifts from how to calculate accounts receivable to how to systematically improve it.
Common Questions We Hear About Managing AR
As finance leaders focus on accounts receivable, a few questions consistently arise. Here are practical answers drawn from our work with professional services firms.
What’s a Good AR Turnover Ratio for a Services Firm?
For most professional services firms, an accounts receivable turnover ratio between 8 and 10 is the optimal range. This indicates clients are paying, on average, every 36 to 45 days—a healthy rhythm for converting work into cash.
A ratio below 8 is a red flag, often signaling an inefficient collections process or overly generous credit terms. A ratio above 10 may suggest your credit policies are too restrictive, potentially turning away good clients who need more flexibility.
Visual Idea: A clean, animated chart showing a firm's DSO dropping over three months after implementing an AR automation solution. The line graph is simple, with annotations pointing out key milestones like "Automated Reminders Activated" and "Client Portal Launched."
How Often Should We Be Calculating These AR Metrics?
Your finance team should review the AR aging report weekly. This frequency is critical for catching negative payment trends before they impact cash flow.
For higher-level metrics like AR Turnover Ratio and Days Sales Outstanding (DSO), a monthly calculation provides a consistent pulse on performance. Of course, modern AR software for professional services can deliver this data in real-time on a dashboard.
The most effective finance leaders build their operational rhythm around reviewing these metrics. This discipline turns historical data into a forward-looking tool to improve cash flow.
Can Automation Really Handle Our High-Value Clients?
Yes. This is a common concern, but it's based on an outdated view of automation. Modern accounts receivable automation is built for sophisticated customization.
You can establish specific rules and communication styles for different client segments. For example:
- Place your highest-value strategic accounts into a unique workflow.
- Configure the system to send an internal alert to the CFO for personal follow-up on invoices over a certain threshold.
- Use AI AR automation to prioritize which accounts require a human touch first.
The goal is to use technology to enhance your most important relationships, not to replace them.
***
Resolut automates AR for professional services—consistent, accurate, and human.