
Calculating Solvency Ratio: A CFO's Guide to Cash Flow
Master calculating solvency ratio with real formulas and balance-sheet examples. Learn how CFOs use these metrics to improve cash flow and reduce risk.
The board deck is open, the lender asks for a solvency view, and the receivables aging still has too many names sitting past due. That's the moment most finance leaders feel the gap between what the balance sheet says and what cash reality is doing.
For professional services firms, calculating solvency ratio isn't a textbook exercise. It's a way to judge whether the firm can absorb delayed collections, fund payroll, and keep working without leaning too hard on the next invoice run.

Why Solvency Ratios Matter for Professional Services Firms
A controller in a consulting or agency firm usually sees the same pattern. Work ships, billing goes out, and cash arrives on a different schedule than the revenue line suggests. That delay matters because solvency ratios test whether the firm has enough resources and earnings capacity to stay upright over time, not just enough cash to cover next week's payroll.
That distinction is why solvency and liquidity can't be treated as synonyms. Wolters Kluwer separates liquidity, which is shorter-term, from solvency, which covers a longer horizon, and that distinction is practical for any firm that lives on milestone billing or project retainers (Wolters Kluwer). A company can look comfortable on a current ratio and still have weak long-term support for its debt load.
What solvency tells a lender or board
Lenders, investors, and credit teams use solvency metrics to see whether obligations are supported by assets, equity, and operating earnings. Standard definitions treat debt-to-equity as total debt divided by total equity, debt-to-assets as total debt divided by total assets, and interest coverage as EBIT divided by interest expense, which gives a clear read on borrowing levels and earnings support (Allianz Trade). That baseline language still matters because it lets different stakeholders compare firms with different capital structures.
Professional services firms feel the pressure faster when receivables slip. If billing is delayed, or collections are loose, the balance sheet can still show assets, but those assets aren't always available cash. For a related operational lens on this issue, see working capital management, because solvency and working capital are linked in day-to-day finance.
Practical rule: if you can't explain how receivables convert into cash by the next board cycle, your solvency story is incomplete.
For owners, the value is blunt. Strong solvency ratios make financing conversations easier, and weak ones usually force harder questions about debt, billing discipline, and collections. If a firm is also weighing turnaround options, external guidance like Miles Hansford Law Firm bankruptcy guidance can help frame the range of remedies before distress becomes irreversible.
Why this matters more in services than in asset-heavy businesses
Professional services firms don't have the cushion of machinery, inventory, or property-heavy collateral. They depend on billable work, timely invoicing, and clients paying on time. That makes the quality of receivables more important than a generic “healthy” balance sheet label.
A firm can also appear solvent while cash is getting squeezed by administrative drag. That's why owners should read solvency alongside collections performance, billing cadence, and customer concentration. The ratio is the snapshot, but the operating process behind it is what decides whether the snapshot improves.
Core Solvency Ratio Formulas and Balance-Sheet Items
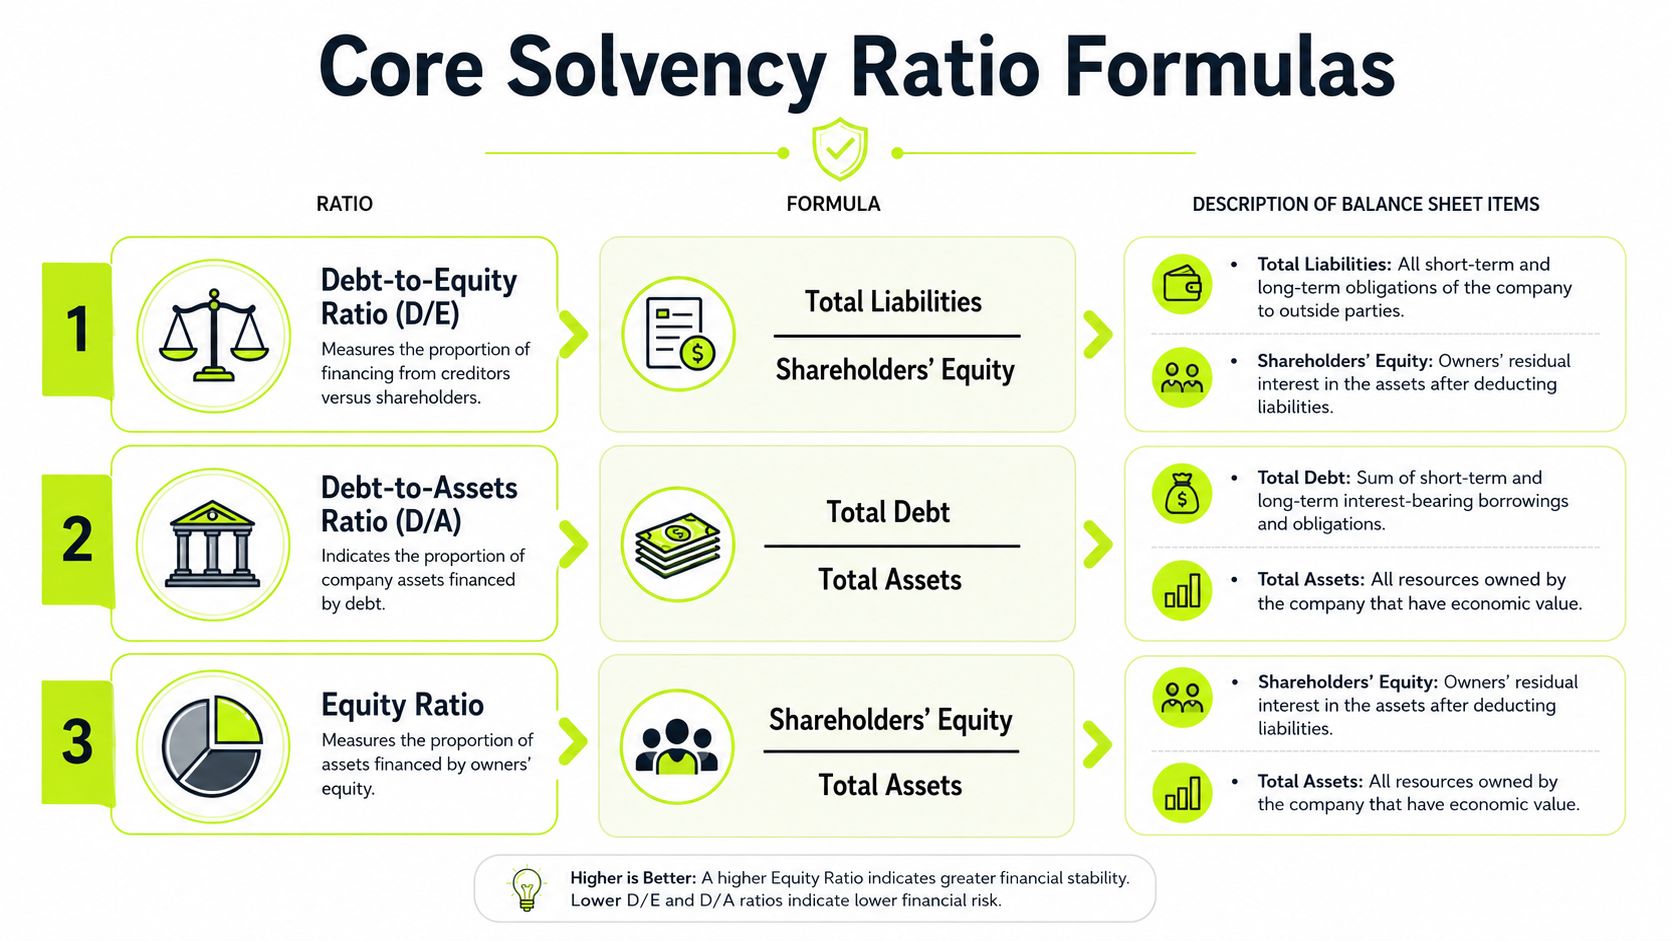
Calculating solvency ratio starts with choosing the right formula, because different teams use the same term for different measurements. Some sources define solvency as total assets divided by total liabilities, while others use equity divided by total assets or debt-to-equity style measures (Wolters Kluwer, Embat via Financlick). Before you run a trend line, lock the definition in writing.
The balance-sheet formulas that show up most often
For a finance team, the most usable starting point is the balance sheet. Debt Ratio = Total Liabilities ÷ Total Assets is one common approach, and Debt-to-Equity = Total Liabilities ÷ Shareholder Equity is another standard solvency measure (SuperfastCPA). If you prefer the inverse view, the equity ratio uses shareholder equity divided by total assets, which tells you how much of the firm is funded by owners rather than creditors.
The items you need are usually straightforward:
- Total liabilities. Add current liabilities and non-current liabilities from the balance sheet.
- Total assets. Use the full asset figure, not just cash or current assets.
- Shareholder equity. Pull the closing equity balance from the equity section.
- Interest expense and EBIT. Use these only when you're reviewing interest coverage rather than balance-sheet solvency (Allianz Trade).
Practical rule: don't mix a balance-sheet ratio with a cash-flow ratio in the same trend line unless you've clearly labeled the formulas.
The usual mistake is moving between formulas without notice. One month's “solvency ratio” might mean equity to assets, while another month's version might mean liabilities to assets. That creates false trend breaks and bad lender conversations.
What to pull before you calculate
A clean calculation needs the most recent balance sheet, a consistent definition of debt, and a clear view of whether the ratio is being used for internal monitoring or external reporting. If the business has leases, debt facilities, or intercompany balances, the team should decide ahead of time whether those items sit inside the ratio.
For a broader ratio framework, the financial statement ratio analysis guide is useful because it puts solvency next to other balance-sheet measures instead of treating it as a stand-alone label.
Worked Numeric Examples for Real-World Context
The cleanest way to understand solvency is to run numbers from a mid-sized professional services firm and see how fast the story changes. A firm with steady revenue can still look fragile if liabilities rise faster than equity, or if collections delay the cash that should support those liabilities.
Ratio | Formula | Example Calculation | Result |
|---|---|---|---|
Debt-to-Equity | Total Liabilities ÷ Shareholder Equity | 100,000,000 ÷ 50,000,000 | 2.0x |
Debt-to-Assets | Total Liabilities ÷ Total Assets | 100,000,000 ÷ 250,000,000 | 0.4x |
Equity Ratio | Shareholder Equity ÷ Total Assets | 50,000,000 ÷ 250,000,000 | 20% |
Cash-Flow Solvency | (Net Income after Tax + Non-Cash Expenses) ÷ Total Liabilities | 30,000,000 ÷ 100,000,000 | 30% |
The first three rows are balance-sheet views. The last row is a cash-flow-style solvency view, which uses the logic described in SMB guidance as net income after tax plus non-cash expenses divided by total liabilities (MyOfficeOps). That difference matters. A firm can carry decent equity and still have weak internal cash generation.
What the examples tell you
A 2.0x debt-to-equity ratio means the firm has two dollars of debt for every dollar of equity. In a professional services firm, that can be manageable or aggressive depending on revenue stability, client concentration, and how quickly invoices are paid. A 0.4 debt-to-assets ratio means liabilities fund a meaningful share of the asset base, while a 20% equity ratio shows how much of the asset base is owner-funded.
The cash-flow example gives a more operational read. If net income after tax and non-cash expenses only cover 30% of liabilities, the firm has some internal support, but it still needs collections discipline to keep obligations comfortably covered. This is the kind of ratio that helps a CFO decide whether to tighten billing, slow discretionary spend, or renegotiate terms.
Why small changes matter
In a services firm, equity can shift from retained earnings, distributions, or one-time charges. Liabilities can move from a new line of credit, tax obligations, or slower vendor payment cycles. A modest change in either side changes every ratio that depends on them.
Practical rule: if a ratio moves sharply and the business story didn't change, check whether the balance sheet changed first. The math is often right, but the underlying classification isn't.
For peer comparison, use the same definition every time and compare against firms with similar contract length, client mix, and billing cadence. A law firm, an engineering consultancy, and a digital agency can't be judged on the same assumptions just because they all sell expertise.
Debt-Based vs. Cash-Flow-Based Solvency Ratios
Debt-based ratios and cash-flow-based ratios answer different questions, and finance teams need both. Debt-based measures tell you how much borrowing sits on the balance sheet. Cash-flow-based measures tell you whether the business can generate enough internal resources to carry that debt over time.
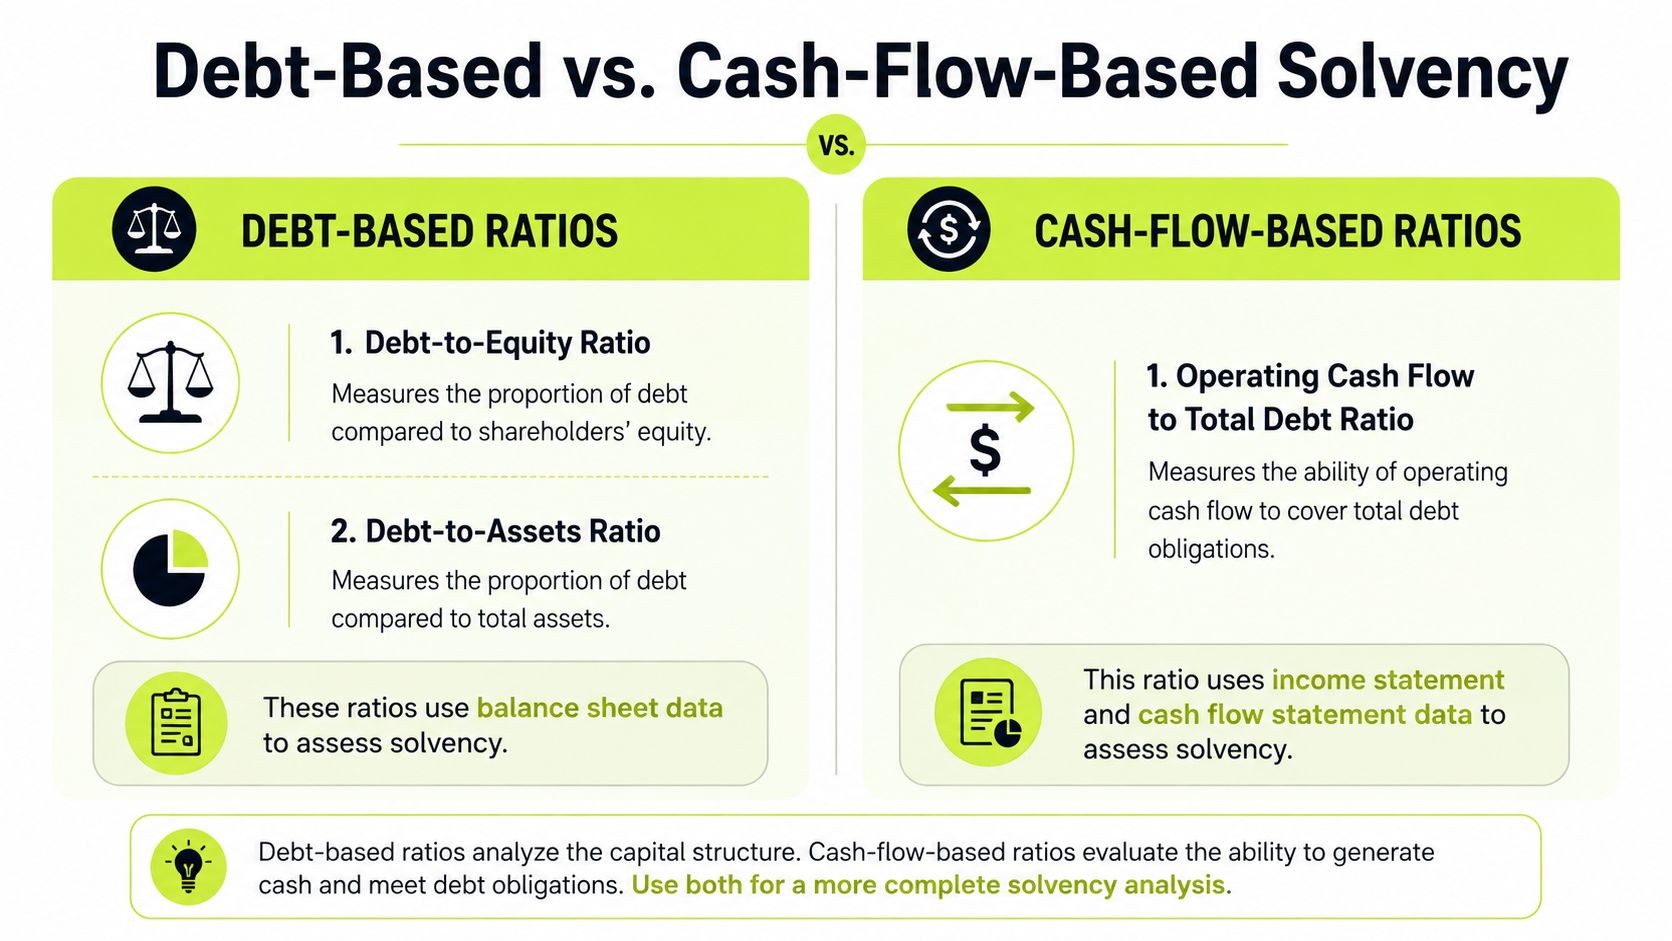
Debt-based ratios are usually faster to calculate and easier to explain to lenders. They rely on balance-sheet data, so they're useful for covenant monitoring, board packets, and month-end close. Cash-flow-based ratios are more operational, because they pull from income statement and cash flow data to judge whether recurring activity can support obligations.
How the two views differ in practice
A debt-to-equity ratio can look fine while collections are aging badly. That happens when equity has accumulated from prior profits, but current invoices are still sitting unpaid. On the other side, a business can have a temporarily tight balance sheet and still generate enough cash to service debt if collections are disciplined and non-cash expenses are sizable.
A useful way to read both together is simple:
- Use debt-based ratios when you want a snapshot of capital structure and financial risk.
- Use cash-flow-based ratios when you want to know whether the business can service obligations.
- Use both when a lender or board wants a complete picture of solvency risk.
For a practical walkthrough of how ratio analysis sits inside broader statement review, the ratio analysis guide is a solid companion reference.
When cash-flow solvency matters most
Professional services firms often collect after delivery, not at delivery. That makes cash-flow solvency especially relevant because unpaid invoices can make the balance sheet look healthier than the bank account does. Finance teams that watch cash conversion closely tend to spot trouble earlier than teams that look only at equity.
Cash-flow solvency is the sharper tool when revenue timing and payment timing don't line up.
The embedded video below is a useful visual for leadership teams that want a side-by-side discussion of debt-based and cash-based perspectives.
Common Pitfalls and How to Avoid Them
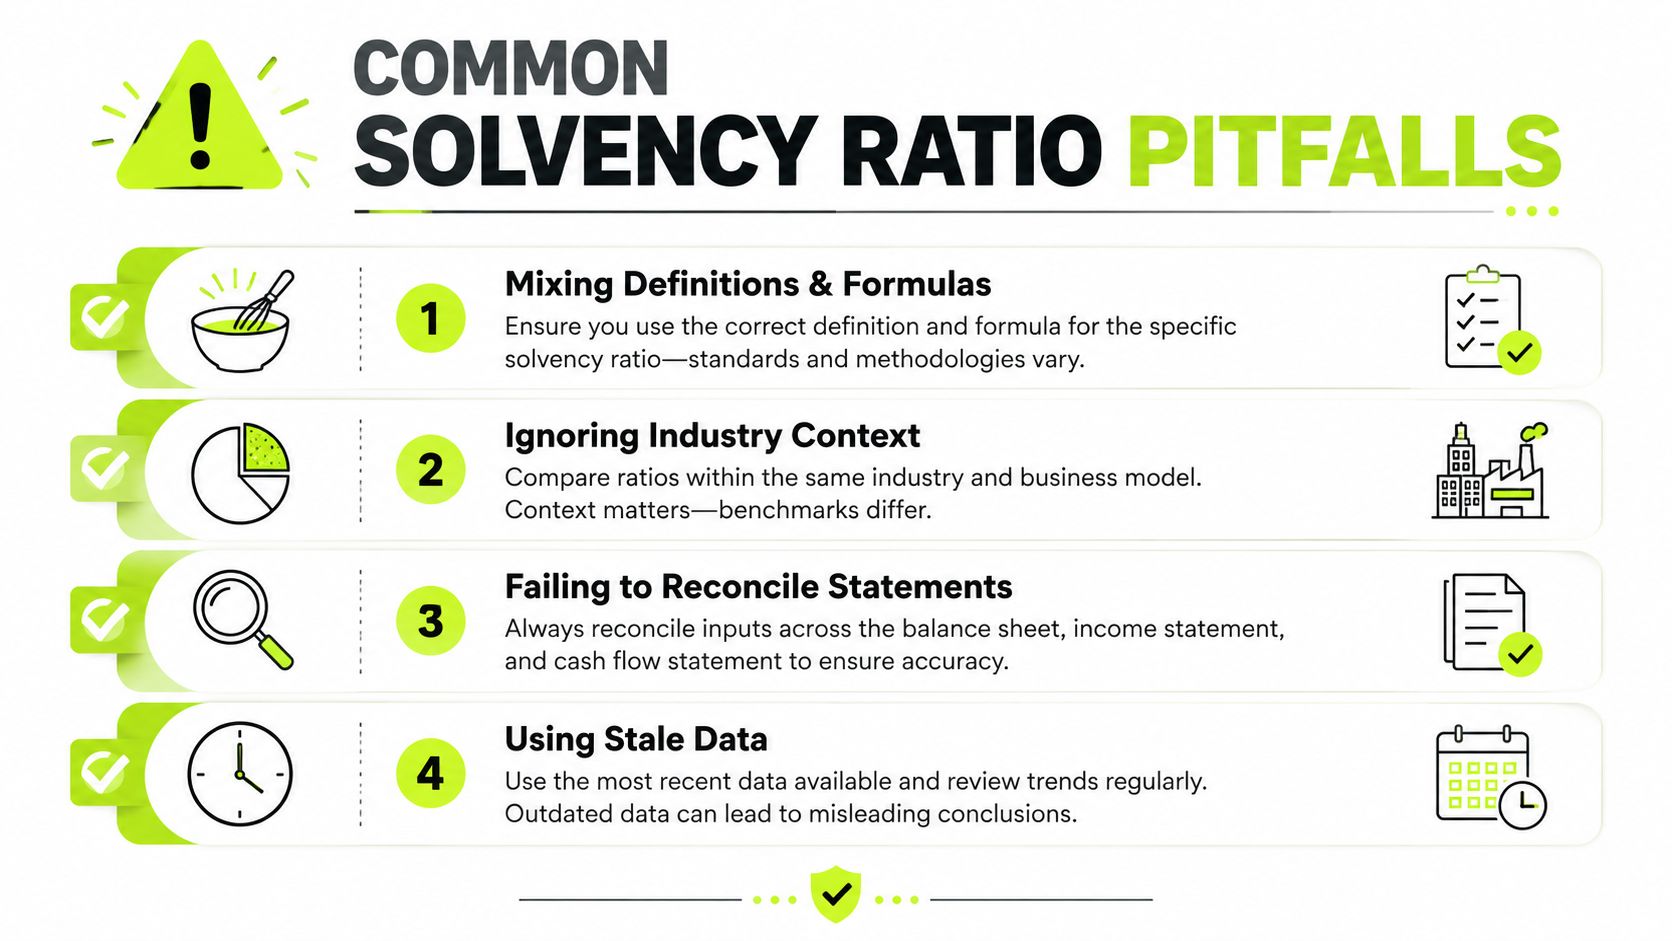
The biggest mistake in solvency work is not the math, it's the definition. Teams often compare ratios across months or lenders without confirming whether they're using debt-to-assets, equity-to-assets, or a cash-based version. That's how good finance teams end up presenting inconsistent trends with confidence.
Where the calculations usually go wrong
The first failure is mixing definitions and formulas. Some sources define solvency as assets divided by liabilities, others as equity divided by assets, and others as debt-to-equity or interest coverage (Allianz Trade, SuperfastCPA). If your team doesn't standardize the version, your trend line isn't a trend line.
The second failure is ignoring industry context. Service firms generally can't carry the same level of debt as asset-heavy businesses, because they have fewer hard assets to back debt. The ratio itself doesn't know your business model. The finance team has to supply that context.
The third failure is using stale or unreconciled data. If receivables, liabilities, or equity haven't been tied out cleanly across the ERP, bank feed, and subledger, the ratio might technically compute while still being misleading. That's a process problem, not a formula problem.
How to tighten the process
Use one formula memo and keep it with the close package. Reconcile liabilities and equity before publishing any solvency view. Then review whether the current period is being compared against prior periods using the same structure and the same cutoff date.
A practical troubleshooting checklist helps:
- Confirm the formula. Write down whether the ratio is debt-based, equity-based, or cash-flow-based.
- Tie the balances. Match liabilities, assets, and equity to the closed financials.
- Check timing. Use the same month-end cutoff for every period.
- Validate receivables. Aging quality affects cash reality even when the balance sheet is intact.
For firms trying to reduce write-offs and clean up collection exceptions, the AR recovery solutions resource is a useful reference point because it frames recovery as an operating process, not just a collection event.
Practical rule: if receivables are late, solvency can still be numerically valid and operationally misleading.
That's especially true in professional services, where a handful of overdue invoices can distort the confidence a board feels in the current balance sheet. Keep the formulas fixed, keep the data current, and keep the operating context visible.
Improving Solvency with AR Automation and Workflows
Solvency doesn't improve from ratios alone. It improves when cash arrives faster, unpaid invoices shrink, and the AR process stops leaking time. In professional services, that usually means getting serious about accounts receivable automation, AI AR automation, and cleaner workflows that support reduce DSO goals without damaging client relationships.
The operating link is direct. If billing goes out late, follow-up is inconsistent, or payment application lags, the firm carries more receivables for longer. That delays cash, weakens the balance-sheet story, and makes any solvency conversation harder to defend. For a closer look at the mechanics, the accounts receivables automation article is a useful internal companion.
What changes the cash picture
Professional services firms usually benefit from a tighter AR cadence, not a louder one. Dynamic billing, cleaner invoice delivery, and automated follow-up reduce the manual friction that keeps invoices open longer than they should stay open. A faster cash cycle gives the firm more flexibility when liabilities come due.
Resolut is one option in this category. It automates AR for professional services by unifying collections, cash application, outreach, and visibility into one workflow, which helps teams improve cash flow without adding more manual chasing.
By addressing the costly, administrative burden of AR, where 1 in 10 invoices go unpaid and enterprises waste $200B annually, Resolut aims to improve cash flow, enhance client relationships, and deliver measurable ROI for companies of all sizes, from startups to enterprises. Those figures come from the publisher's product brief, so they're useful as directional context rather than a general market average.
Where the workflow pays off
The most useful automations are usually the unglamorous ones. Automated cash application cuts down on unapplied receipts. Omnichannel outreach keeps follow-up consistent. Better visibility into outstanding balances helps finance teams spot problem accounts before they become write-offs.
For firms that want to improve solvency metrics in a controlled way, the sequence is straightforward:
- Invoice faster. Reduce the delay between work completion and billing.
- Follow up consistently. Keep reminders structured instead of ad hoc.
- Apply cash quickly. Tie payments to invoices without waiting for manual matching.
- Escalate early. Surface at-risk accounts before aging gets out of hand.
A soft visual for leadership decks is a cash-conversion timeline that starts at project completion, runs through invoice issuance, and ends at bank settlement. Another useful image is a funnel showing invoices moving from open to paid, with the aging buckets shrinking as automation takes hold.
When the AR engine runs more cleanly, solvency ratios usually stop looking like a warning light and start looking like a management output. That's the goal for CFOs and Controllers, not a prettier spreadsheet.
Resolut automates AR for professional services, with workflows built to keep collections organized, cash application accurate, and receivables visible. If you're trying to improve solvency by reducing DSO and tightening cash flow, visit Resolut to see how the platform supports that work in a controlled, human way.