
What Is Working Capital and Why It Matters
Learn what is working capital, how to calculate it, and the practical levers CFOs use to free cash, cut DSO, and run a calmer finance operation.
Working capital is current assets minus current liabilities, the short-term liquidity buffer that keeps a firm paying its bills between invoice and collection. A positive balance means the business has more short-term resources than short-term obligations.
A 30-person consultancy can win a $1.2M annual contract, report rising revenue, and still have a thinner bank balance than last quarter while payroll is due Friday. The issue isn't profitability alone. It's the timing gap between work delivered, invoices collected, employees paid, and vendors settled.
For CFOs, Controllers, and firm owners, working capital is best treated as an operational system, not a textbook ratio. You can tune the system through billing speed, collections discipline, payment terms, and visibility into cash conversion.
The Short-Term Liquidity Buffer Most Firms Stop Watching
The consultancy has signed the contract, staffed the work, and started delivering. Its income statement looks healthy. Yet the client won't pay until the invoice clears its approval process, while payroll and contractor obligations arrive on schedule.
That gap is working capital in practical terms. The firm is owed money through accounts receivable, but it also owes money through payroll accruals, accounts payable, taxes, debt obligations, and other near-term liabilities. The balance sheet shows whether the short-term resources can cover those commitments, but the operating cycle explains why the balance is changing.
Current assets usually include cash, accounts receivable, inventory, and other resources expected to convert to cash within one year. Current liabilities include accounts payable and other obligations due within one year, as described by J.P. Morgan's working capital formula guide.
CFO perspective: Revenue creates the opportunity. Collections timing determines whether the firm can comfortably fund it.
Working capital isn't the same as cash on hand. Cash is immediately available. Receivables may be collectible but still unavailable for payroll today. Prepaids and other current assets may support operations without giving the firm spendable liquidity. A positive working-capital balance can therefore coexist with cash pressure when too much of that balance sits in slow-moving receivables.
Fast-growing professional services firms often watch revenue, gross margin, and utilization closely while letting this balance-sheet signal deteriorate. The warning signs usually appear before a crisis: invoices go out late, unbilled time accumulates, collection follow-ups depend on memory, and the bank balance needs more explanation every month.
The right question isn't, “Do we have positive working capital?” Ask instead, how much cash is trapped between delivering work and receiving payment, and which operating decision trapped it?
The Working Capital Formula and a Worked Example
The core calculation is straightforward:
Working Capital = Current Assets − Current Liabilities
The related net working capital ratio is:
Current Assets ÷ Current Liabilities
The ratio provides a quick health check, while the dollar balance tells you how much short-term capacity remains after near-term obligations. For a useful refresher on how the calculation behaves when balance-sheet accounts change, finance teams can master the change in working capital formula.
Recreate the calculation from the balance sheet
Use the following condensed example for a fictional 30-person services firm.
Line Item | Amount (USD) |
|---|---|
Cash | $180,000 |
Accounts receivable | $520,000 |
Prepaid expenses | $40,000 |
Other current assets | $30,000 |
Total current assets | $770,000 |
Accounts payable | $145,000 |
Accrued payroll | $210,000 |
Deferred revenue | $95,000 |
Current portion of debt | $60,000 |
Total current liabilities | $510,000 |
Working capital | $260,000 |
The firm has $260,000 of working capital, calculated as $770,000 minus $510,000. Its working capital ratio is approximately 1.5, calculated as $770,000 divided by $510,000.
That result looks serviceable, but the composition matters. More than half of the current assets sit in accounts receivable, not cash. If collections slow, the firm's nominal working capital remains positive while its immediate liquidity becomes less comfortable.
For operating purposes, use these practical thresholds:
- Above 1.5: Generally comfortable, provided receivables are collectible and cash forecasts support upcoming commitments.
- Between 1.1 and 1.4: Watch the trend. A modest deterioration in collections or an unexpected payroll increase can narrow the buffer quickly.
- Below 1.0: Current liabilities exceed current assets, so the firm is effectively relying on incoming receipts, financing, or delayed payments to fund operations.
Don't manage the ratio in isolation. Review the underlying accounts monthly, then connect changes to DSO, invoicing latency, accrued payroll, and payment timing.
How the Cash Conversion Cycle Drives Working Capital
The cash conversion cycle, or CCC, measures how long cash remains tied up between paying for inputs and receiving customer payment. The standard framework is:
CCC = DIO + DSO − DPO
DIO represents days inventory or work in process remains tied up. DSO represents the time required to collect receivables. DPO represents the time the firm takes to pay suppliers.
Professional services firms may not carry traditional inventory, but unbilled work in process can play a similar role. A consultant who has delivered work but hasn't issued an approved invoice has created value that hasn't yet become cash.
A small operating example
Assume a firm has:
- $100,000 of accounts receivable at 60 DSO
- $40,000 of project costs in work in process at 20 DIO
- $30,000 of accounts payable at 25 DPO
The cash conversion cycle is 55 days, calculated as 20 plus 60 minus 25. In this example, roughly $150,000 of working capital is locked in the cycle, based on the stated receivables, work in process, and payable balances.
The precise dollar interpretation depends on the firm's operating base and accounting conventions. The management lesson is clear: the balance-sheet snapshot tells you the position, but the CCC tells you the operating motion that produced it.
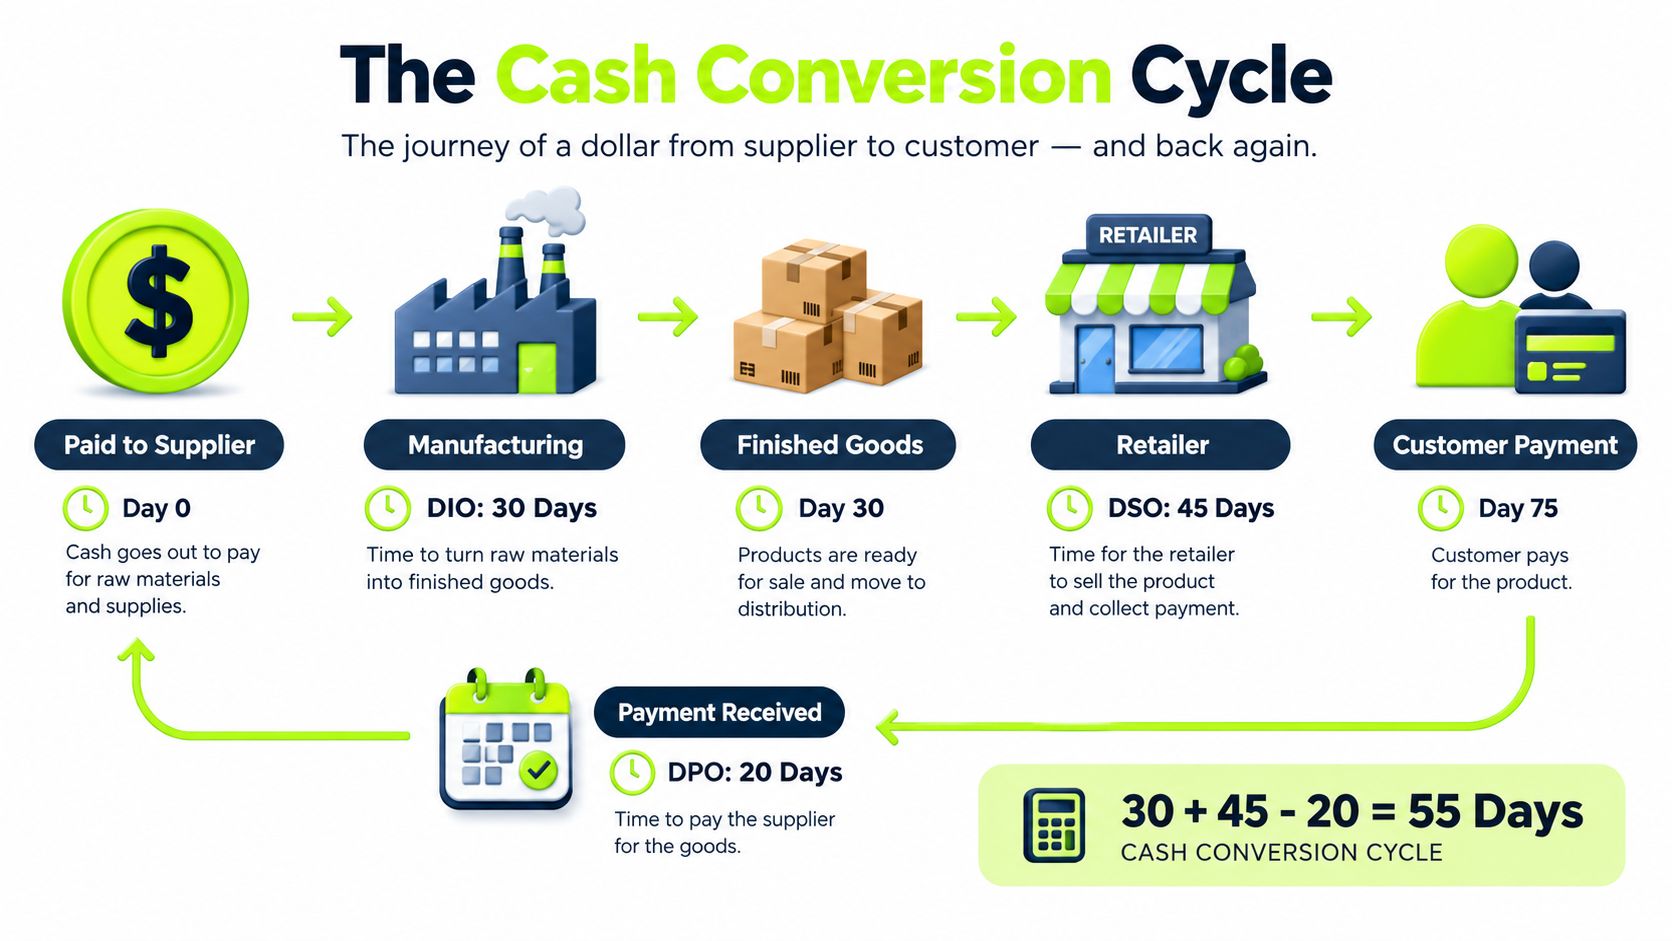
The cycle is usually expressed as Inventory Conversion Period + Receivables Collection Period − Payables Deferral Period, a structure explained in MIT's working capital and CCC lecture. For broader operational context, finance and operations leaders can use this supply chain KPIs guide.
A shorter CCC doesn't require revenue growth. Faster invoicing, fewer billing disputes, more efficient collections, lower work-in-process days, or commercially sound supplier terms can release cash without changing the top line.
That's why CFOs should monitor CCC alongside the monthly balance sheet. A positive balance can conceal a lengthening cycle, and a stable balance can conceal rising dependence on external funding.
Why Working Capital Is a Value Creation Lever
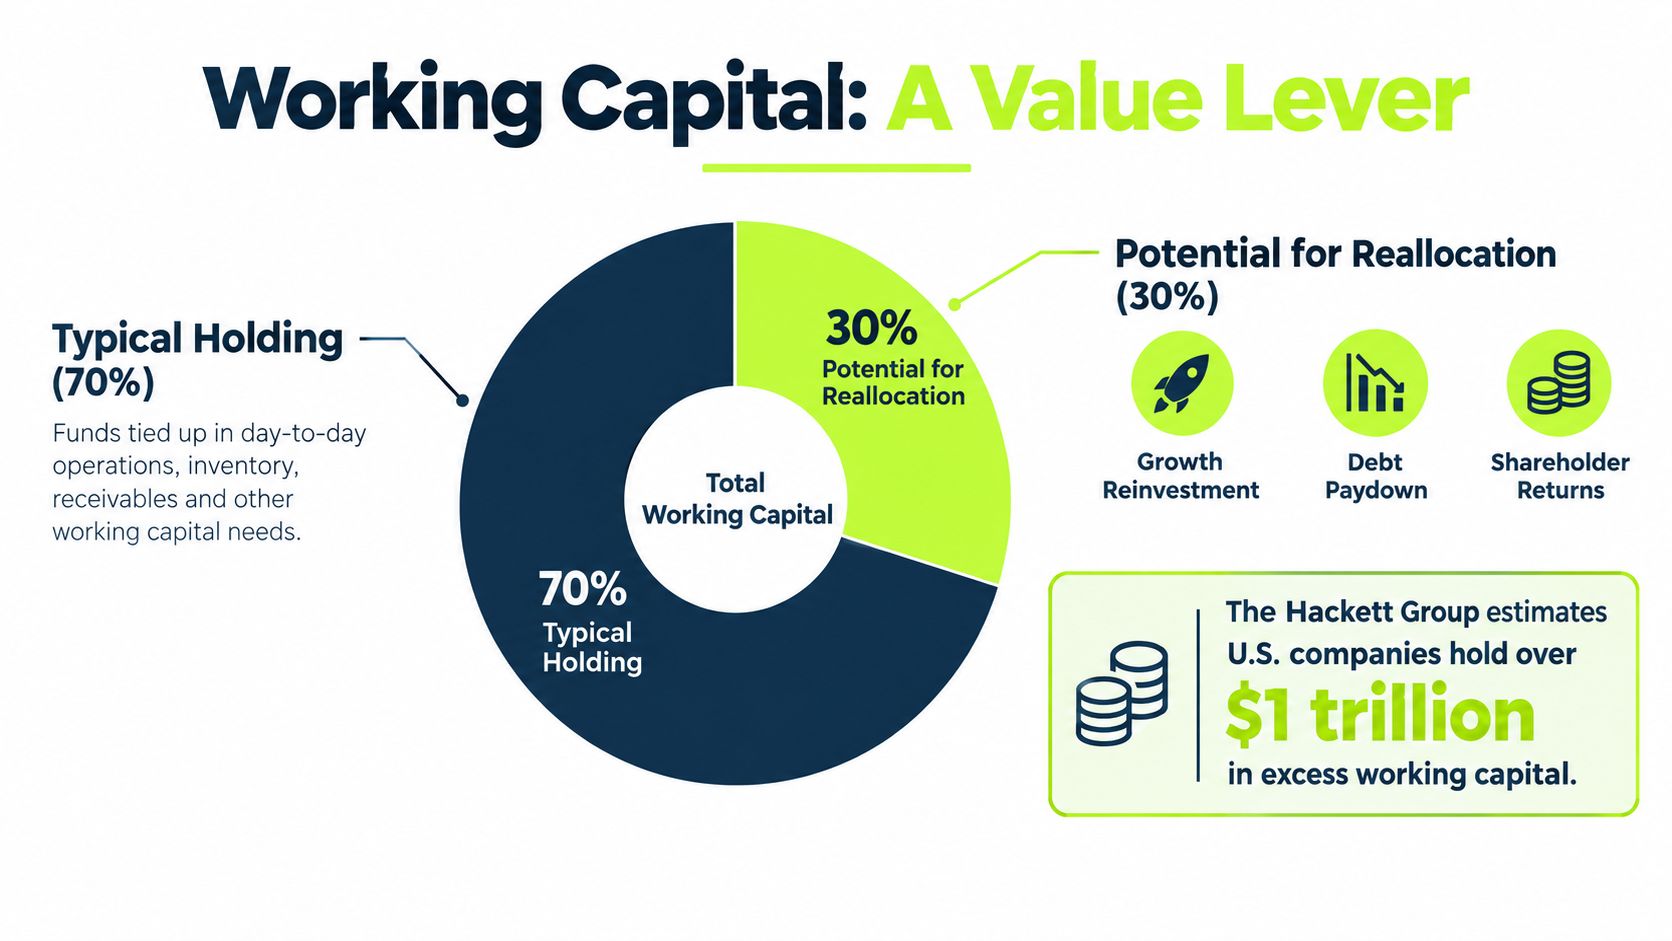
Working capital is a funding source the firm already owns. When you reduce the cash trapped in receivables or work in process, you can redeploy that cash into hiring, growth investments, debt reduction, or shareholder distributions without first raising new capital.
The scale is substantial in larger companies. The Hackett Group estimated $1.7 trillion in excess working capital across the top 1,000 U.S. public nonfinancial companies in 2025, and its 2026 coverage referenced $1.94 trillion, according to The Hackett Group's working capital survey. Those figures don't translate directly to a $3M–$50M professional services firm, but they establish the point: stable headline liquidity can coexist with significant operational cash trapped in receivables and inventory.
The mid-market trade-off
For a services firm, the most accessible lever is usually receivables. The firm doesn't need to redesign a factory or sell stock. It needs accurate invoices, clean approval requirements, disciplined follow-up, and easy payment execution.
A DSO improvement on a $50M revenue book translates into meaningful cash movement. Each day represents approximately $137,000 of revenue, calculated by dividing $50M by 365. A 5-day reduction therefore represents roughly $685,000, while a 7-day reduction represents roughly $959,000, before considering revenue mix and collection patterns.
Those amounts are not automatically profit. They represent cash released from receivables, which the firm can use more productively. The cost of releasing that cash through better operating execution is generally far lower than borrowing against the same need.
Board framing: Working capital is often the cheapest source of capital because the firm has already earned it. The work is converting that value into cash on schedule.
Regional benchmarks also require discipline. Aon's 2026 APAC benchmark covered 3,805 listed companies across 14 markets and 21 industries, and reported that the regional average stayed broadly steady from 2024 to 2026, as described in Aon's APAC working capital benchmarking report. Don't compare a professional services firm to a universal benchmark. Segment by geography, industry, client mix, and billing model.
DSO and the Receivables Benchmarks That Matter
Days Sales Outstanding, or DSO, converts receivables into an operating clock. The common formula is:
DSO = Accounts Receivable ÷ Revenue × 365
Some firms use total credit sales instead of revenue in the denominator. Use one definition consistently, document it, and avoid changing the formula because the result looks uncomfortable.
On a $50M revenue book, each DSO day represents roughly $137,000 in receivables, based on $50M divided by 365. That translation lets a CFO connect an accounts receivable initiative to cash flow rather than treating DSO as an accounting dashboard statistic.
For professional services firms, benchmark content places typical DSO around 30 to 60 days, with top performers closer to 35 to 40 days and some benchmark sets describing under 45 days as excellent, according to Daylit's professional services AR benchmark discussion.
Use bands, not vanity targets
Performance band | Weighted DSO (days) | Cash tied up in AR | Implied working capital drag |
|---|---|---|---|
Strong professional services performance | 35–45 | Lower receivables balance | Lower operating drag |
Typical range | 30–60 | Varies with billing volume | Manageable but material drag |
Watch category | 60+ | Larger receivables balance | Increasing liquidity pressure |
The table is a management lens, not a universal standard. Client concentration, milestone billing, retainers, approval chains, and contractual terms can all affect the right target.
Weighted DSO is more useful than scanning an aging report without a decision rule. Aging tells you where balances sit by bucket. DSO tells you how much cash the entire receivables book consumes relative to revenue.
A DSO-adjusted measure can also help when a one-time invoice distorts the headline number. Exclude non-recurring invoices only when the adjustment is documented and applied consistently. Otherwise, the adjusted metric becomes a way to hide the problem rather than isolate it.
For a deeper explanation of the calculation and its management use, see what DSO means for finance leaders. The practical conclusion is direct: AR software for professional services should turn the DSO dial, not merely produce another aging report.
Working Capital Problems You Can Diagnose This Week
Most professional services working-capital problems don't begin with a dramatic event. They begin with a process that works adequately at a smaller scale, then fails as the client base, project count, and invoice volume increase.
The AR aging cliff
Look at the shape of the aging report. If a meaningful share of receivables moves past 60 days, the firm may lack an escalation step between sending the invoice and making a collections call. The symptom is usually a thickening older bucket, repeated promises to pay, and account managers discovering disputes only after finance asks for help.
Track weighted DSO, current receivables, disputed invoices, and the time from due date to first escalation. The operational fix is not “collect harder.” It's assigning the next action, owner, date, and communication channel before the invoice becomes overdue.
The billable-hours inventory problem
Professional services firms can accumulate a hidden form of inventory when engagement managers prioritize utilization over invoicing cadence. Time is delivered, approved work sits unbilled, and the firm carries payroll cost before it records a collectible receivable.
The controller usually sees unbilled days creeping up, late timesheet approvals, and month-end billing spikes. Track unbilled work by engagement, manager, age, and reason code. If the same project repeatedly misses billing cutoffs, the issue belongs with delivery leadership, not only accounts receivable.
AP asymmetry
A firm that pays vendors on day 21 while billing clients on net 30 creates a permanent timing drag. The problem appears when DPO falls while DSO rises, even if total expenses remain stable.
Review payment timing against contractual terms, not just invoice-processing speed. Pay on time, but don't pay prematurely because the workflow is convenient. For a broader operating approach, use this guide on how to improve working capital.
Controller's test: Every working-capital symptom should map to a named owner and a metric that can move within the next reporting cycle.
The three diagnoses often reinforce each other. Late time approval delays invoicing, delayed invoices increase DSO, and early vendor payments consume the cash that should have covered payroll while the firm waits for collection.
How AR Automation Releases Working Capital
AR automation works when it removes specific delays from the receivables process. It should issue an accurate invoice when the service milestone is reached, send reminders before and after the due date, provide a simple payment path, and route exceptions to a person who can resolve them.
That mechanism matters more than the label attached to the software. Accounts receivable automation should reduce manual handoffs between project managers, billing staff, collectors, and cash application. AI AR automation can help prioritize at-risk invoices and adapt outreach, but it won't fix unclear billing terms or disputed work.
Translate DSO into released cash
Consider a firm with $40M in annual revenue. At 65-day DSO, receivables represent approximately $7.12M, calculated as $40M divided by 365 and multiplied by 65. At 48-day DSO, the comparable balance is approximately $5.26M.
The difference is roughly $1.86M, or about $1.9M released from receivables, assuming the revenue base and calculation method remain consistent. The arithmetic is a planning example, not a promised performance result.
Metric | Manual AR | Automated AR (Resolut) |
|---|---|---|
Annual revenue | $40M | $40M |
DSO | 65 days | 48 days |
Implied AR balance | Approximately $7.12M | Approximately $5.26M |
Receivables released | Baseline | Approximately $1.9M |
The same logic applies to firms seeking QuickBooks AR automation. The accounting system may hold the invoice and payment records, but the operating layer must help finance decide who needs a reminder, which dispute needs escalation, and when a payment should be matched.
AP automation can matter, particularly where the firm pays suppliers before terms require it. But DSO is often the right starting point for professional services because the receivable side contains the most direct link between delivered work and unavailable cash.
Resolut is one example of an AR automation platform that combines credit risk assessment, collections workflows, omnichannel outreach, payment orchestration, and cash application. The relevant evaluation criteria are practical: whether the system supports human review, integrates with the firm's accounting workflow, and gives the CFO a reliable view of expected collections.
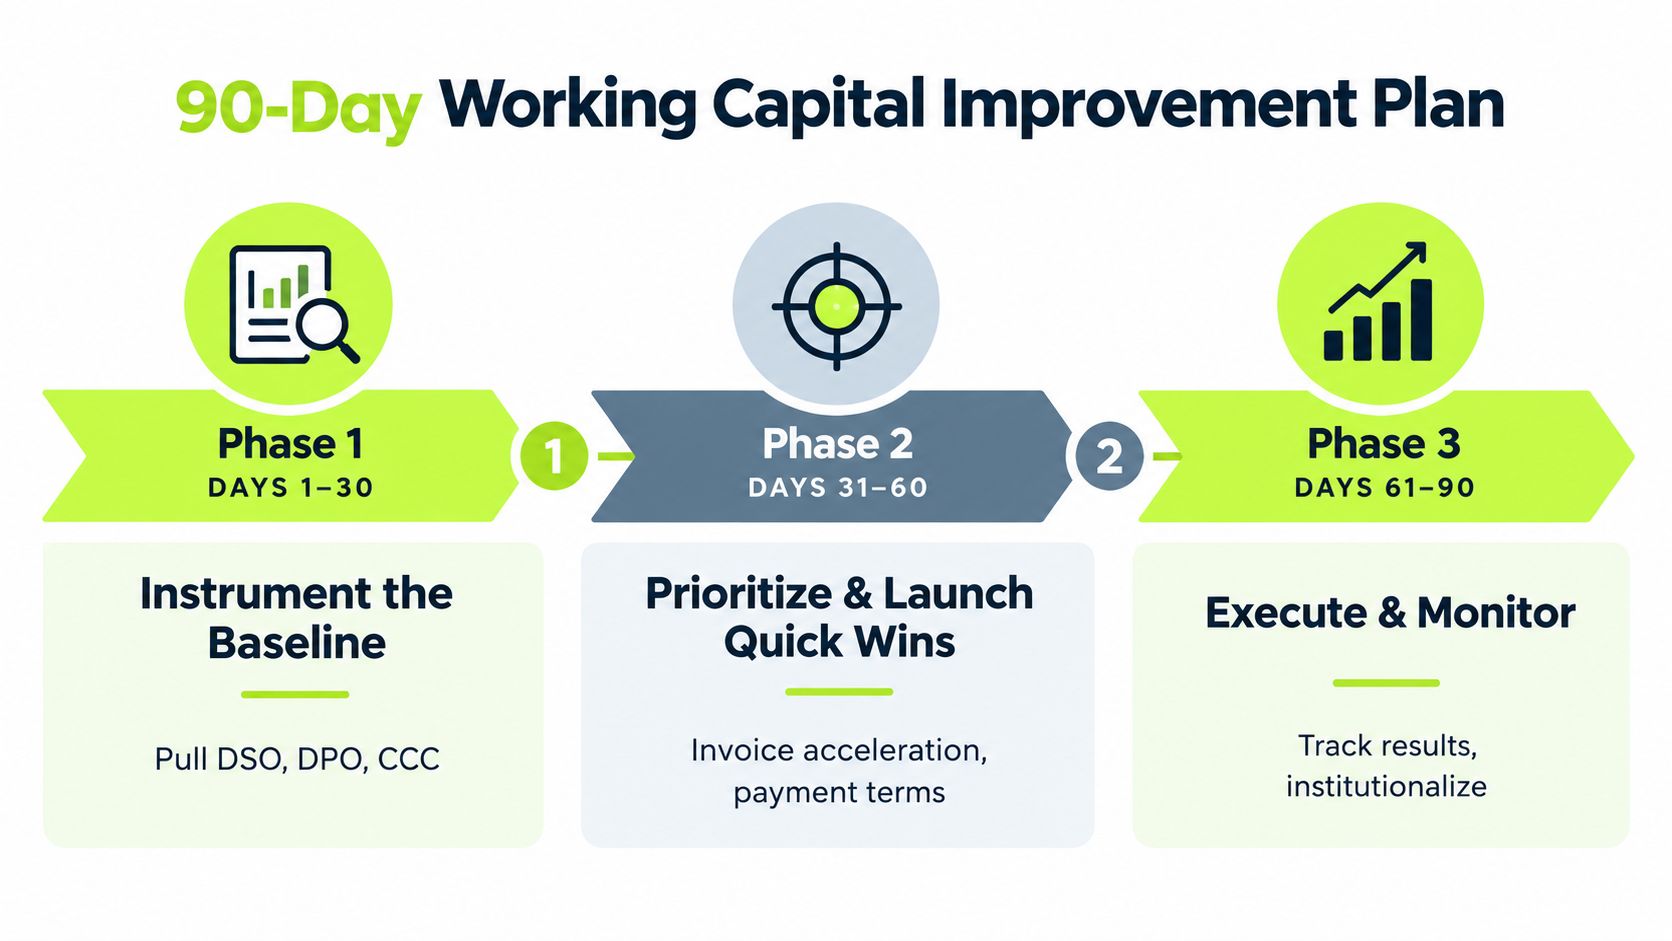
A 90 Day Working Capital Improvement Plan
Run the plan without creating a new department. Give each action an owner, establish a baseline, and review the result against the same definitions every week.
Days 1 through 30
Pull trailing-12-month DSO, DPO, and CCC by entity, client segment, and major service line. Reconcile the calculations to the general ledger and identify where revenue, credit sales, work in process, and payables differ in treatment.
The Controller owns the data. The fractional CFO or CFO owns the interpretation. Allow roughly four to eight hours for the initial extraction and reconciliation, then document the formula so nobody resets the baseline later.
Compare the firm with relevant Hackett and Aon reference points only where the business model and geography make the comparison meaningful. Aon's APAC coverage demonstrates why country and industry segmentation matters, while Hackett's work highlights the scale of excess capital trapped in larger-company operations.
Days 31 through 60
Fix the two largest leaks. In most professional services firms, those are invoicing latency and payment friction.
- Invoicing latency: The Billing Manager owns same-cycle invoice issuance, approval deadlines, and rejection tracking.
- Payment friction: The Controller owns payment instructions, portal access, remittance capture, and dispute routing.
- Client accountability: Account leaders own commercial disputes and must respond within an agreed internal timeframe.
Budget roughly eight to twelve hours for workflow mapping and stakeholder alignment, then measure invoice-to-delivery lag, disputed invoice age, and payment completion rate.
Days 61 through 90
Deploy or configure AR automation, then set a working target of 8 to 12 DSO days lower only if the baseline supports it. That target is a management objective, not a guaranteed outcome.
Track DSO and CCC weekly, alongside cash collected, invoices issued, overdue balance, and unresolved disputes. Review the working capital management framework for the governance principles behind this cadence.
If growth, acquisition, or ownership transition requires financing alongside operational improvements, finance leaders can review GoSBA Loans for business buyers as a separate funding resource. Financing can bridge timing gaps, but it shouldn't replace fixing a recurring collection problem.
Review the working-capital scorecard monthly with the leadership team. Keep the owners visible, tie DSO and CCC movement to operating decisions, and prevent the process from drifting back over the following two quarters.
Resolut automates AR for professional services through structured follow-ups, payment orchestration, cash application, and visibility into expected collections. Visit Resolut to evaluate whether it can help your firm reduce DSO and improve cash flow with a consistent, accurate, and human operating process.