
How to Calculate ROI for AR Automation
Learn how to calculate ROI for AR automation with a finance-grade framework. Covers DSO, payback, NPV, and worked examples for professional services.
Friday afternoon, the aging report is still open on your screen. Two anchor clients sit beyond agreed terms, the board wants a working-capital update on Monday, and an AR automation vendor has sent a one-page claim about faster collections. You could forward the claim to the CFO, but you can't defend it against your firm's actual DSO, write-offs, staffing model, and cash position.
That gap isn't enthusiasm. It's rigor. To calculate ROI for AR automation, you need three artifacts before you evaluate a vendor: a current-state baseline, a defensible benefit calculation, and a complete cost stack that includes implementation drag. The framework below builds all three for CFOs, Controllers, and owners of professional services firms with meaningful invoice volume and limited patience for unsupported promises.
The Friday Afternoon ROI Problem
At a professional services firm, collections rarely belong to one person. An AR specialist follows up on overdue invoices, a billing manager corrects time and expense issues, a partner calls a client about a disputed fee, and an operations lead helps resolve missing purchase-order details. The general ledger records the result, but it usually doesn't show the full labor consumed along the way.
That makes a vendor's percentage claim almost useless by itself. A claimed improvement has to be tested against your current DSO, aging concentration, write-off history, and the cost of the people doing collection work today. Otherwise, you're comparing a marketing assumption with an operating reality.
Start with the baseline. Pull a trailing view of collections performance from the ERP, separate billed from unbilled receivables, and identify where overdue balances sit. Then quantify benefits in cash terms, not activity terms. More reminders sent aren't a benefit. Cash collected earlier, labor redeployed, and avoidable losses prevented are benefits.
Finance rule: If the vendor can't show how its projected return connects to your ledger, aging report, and staffing data, the number isn't a forecast. It's an assertion.
The third artifact is the cost stack. License fees are only one line. Implementation, data cleanup, training, internal project time, exception handling, and slower collections during cutover all belong in the investment denominator. The true cost of AR inefficiency in professional services is broader than overdue invoices, and your ROI model should reflect that.
Some firms also evaluate conversational AI for revenue recovery when they want to understand how automated, human-sounding outreach can support follow-up workflows. That can be useful context, but it doesn't replace a firm-specific model. The rest of this article gives you the structure to build one before the next vendor call.
What ROI Actually Measures
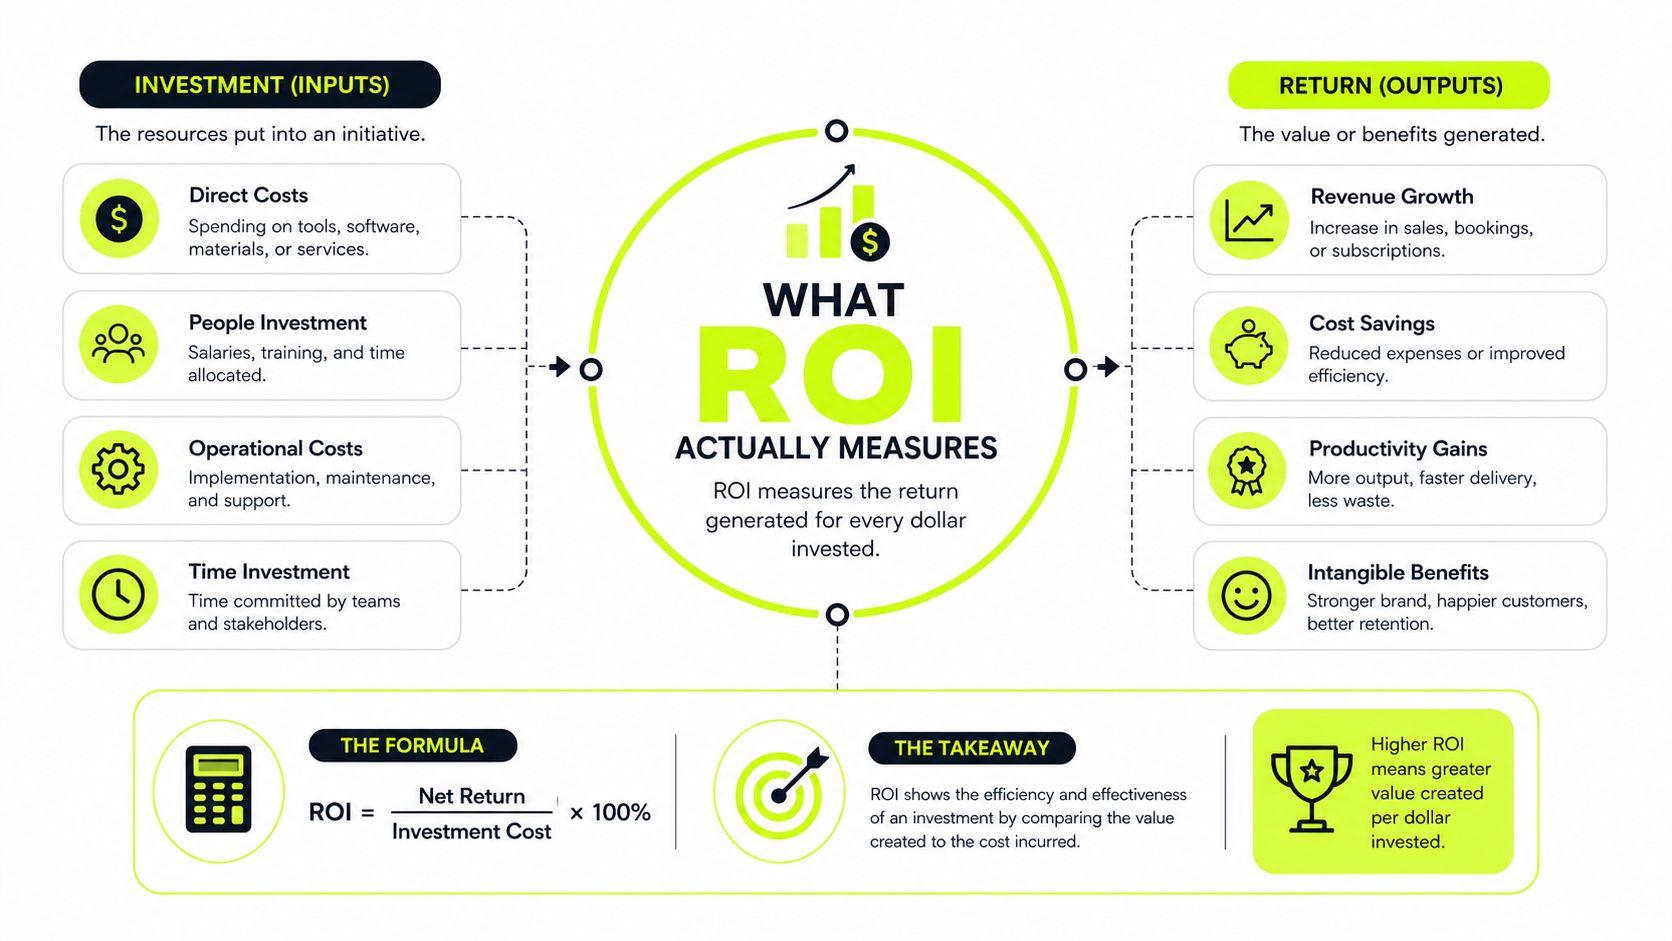
The standard definition is simple: ROI equals net benefits divided by total costs, expressed over a defined period. The common formula is:
ROI = (gain from investment − cost of investment) ÷ cost of investment × 100
The metric's business lineage is older than modern SaaS. ROI is widely traced to Donaldson Brown at DuPont in 1914, when he combined earnings, working capital, and investment in plants and property into a single measure called return on investment. That history matters because the metric was built for capital allocation, not for producing attractive retrospective slides. You can review the ROI formula and examples for the basic mechanics, but AR automation requires more discipline than the textbook example.
Gross ROI versus net ROI
A vendor's gross ROI usually treats the expected operational gain as if it arrives immediately and costs consist mainly of subscription fees. A finance-grade net ROI includes implementation services, internal labor, training, maintenance, financing charges, opportunity cost, and the time required to reach steady-state performance. The denominator must contain the all-in investment, not the line item that looks easiest to approve.
Benefits also arrive unevenly. A new workflow may produce limited value during configuration, improve as staff learn the process, and reach its intended run rate only after exceptions and client behavior are understood. Labor savings depend on redeployment. If the team remains fully staffed and performs different work, that value may be real capacity, not immediate P&L savings.
The percentage still matters, but it doesn't answer the board's most practical question: when does the cash come back? Add payback period for recovery timing, NPV for present-value allocation, and IRR for ranking opportunities with different cash-flow profiles.
A raw ROI also isn't time-normalized. A return over a short holding period is economically different from the same return spread across multiple years. For multi-year comparisons, annualize the result with:
Annualized ROI = [(1 + ROI)^(1/n) − 1] × 100
Here, n is the holding period in years. Use this alongside, not instead of, a cash-flow schedule.
The video below provides another visual explanation of the basic concept. Review it after the formula, then apply the logic to your own AR data.
Baseline Metrics You Need Before the Model
Don't start with the vendor's expected improvement. Start with your own operating facts. A baseline pulled in two days will beat a polished model built in two weeks on assumptions no one can audit.
Pull five measures from the systems that own them
Current DSO should use a trailing average rather than a single favorable month. DSO measures the average time required to collect after invoicing. A common formula is accounts receivable divided by average daily revenue, while another professional-services formulation expresses it as AR divided by total credit sales, multiplied by the number of days. Exclude unbilled receivables when measuring collection performance, as advised in this accounts receivable KPI guide.
AR aging by bucket shows whether the problem is broad or concentrated. Pull balances by current, overdue, and materially aged categories, then identify the clients and dollars sitting beyond the aging threshold that matters to your firm. A large balance concentrated among a few clients requires a different intervention from many small overdue invoices.
Collections labor hours must include calls, emails, invoice delivery, dispute resolution, cash application support, and manual status reporting. Use payroll, time tracking, workflow logs, and interviews with billing, AR, operations, and client-service staff. Don't count only the hours coded to an AR department.
Trailing write-offs as a percentage of revenue should come from the general ledger and be reconciled to credit memos and bad-debt accounts. Separate genuine credit adjustments from balances written off because the firm failed to resolve a dispute or pursue collection.
Average days to pay by client segment belongs in the model because payment behavior varies by contract type, client size, industry, and billing arrangement. Use CRM, contract, and customer master data to create segments that finance and client-service leaders recognize.
Baseline Metrics Checklist | Formula | Data Source | Common Error |
|---|---|---|---|
DSO | AR ÷ average daily revenue | ERP or accounting system | Using one good month |
AR aging | Balance by aging bucket | ERP or accounting system | Ignoring concentration |
Collections labor | Logged or allocated hours | Payroll and time tracking | Excluding billing and operations |
Write-off rate | Write-offs ÷ revenue | General ledger | Mixing credits with bad debt |
Segment payment days | Average collection days by segment | CRM and contract data | Ignoring contract differences |
Seasonality can distort both DSO and payment behavior. Compare the baseline across a meaningful trailing period, and document unusual events such as a major client dispute, billing-system transition, or acquisition. The model is only as credible as the definitions behind its inputs.
Quantifying the Benefit Side
Benefits should enter the model as cash, avoided cost, or recoverable capacity. Don't assign value to a dashboard, a higher reminder count, or an attractive promise about AI AR automation. Those are mechanisms. The return is what changes in the firm's economics.
Cash released through DSO improvement
The cleanest working-capital calculation is:
Cash released = DSO reduction × average daily revenue
Use the ERP's trailing revenue and receivables data as the source of truth. This is generally a one-time working-capital release, not recurring annual revenue. If the process keeps DSO lower, the firm retains better liquidity, but you shouldn't count the same released cash as a new benefit every year.
For a $20M professional services firm, a modeled cash-release range of $200K to $1.2M can be used as an editorial planning range, provided the actual DSO reduction and revenue base support it. Treat that range as a scenario boundary, not a benchmark guarantee.
Reclaimed collections capacity
Labor savings require a redeployment decision. Calculate:
Labor benefit = hours reclaimed × fully loaded hourly cost
You can also model this as FTEs multiplied by fully loaded annual cost, with a planning range of $65K to $85K per FTE for the specified professional-services scenario. That value becomes a recurring annual benefit only if the firm reduces spend or redeploys capacity to billable, revenue-producing, or higher-value control work.
Partial redeployment still counts. A team that stops chasing routine reminders and spends more time resolving complex disputes may create measurable capacity without reducing headcount.
Fees, interest, and bad debt
Pull card-processing charges, late-payment penalties, bank fees, and line-of-credit interest from the GL and treasury records. Earlier payment can reduce financing costs and certain payment-related charges, but only count the portion that the new process can reasonably affect.
Bad-debt avoidance uses:
Avoided bad debt = baseline write-off rate − modeled write-off rate, multiplied by revenue
Use the firm's historical rate and test an improvement range of 0.3% to 1.0% of revenue only as a conservative scenario input for the stated model. Don't present it as an expected outcome without evidence from your own dispute and write-off history.
Benefit Streams for AR Automation ROI Models | Formula | Typical Range ($20M Firm) | Frequency |
|---|---|---|---|
DSO-driven cash release | DSO reduction × average daily revenue | $200K–$1.2M | Usually one-time |
Labor capacity | FTEs or hours reclaimed × loaded cost | $65K–$85K per FTE | Recurring if redeployed |
Fees and interest | Avoidable charges before minus after | Firm-specific | Recurring |
Bad debt avoided | Write-off-rate improvement × revenue | 0.3%–1.0% of revenue scenario | Recurring if sustained |
Keep a separate column for cash benefit, P&L benefit, and capacity benefit. A dollar of working capital released isn't the same as a dollar of profit, and a labor hour reclaimed isn't automatically a payroll reduction.
Building the Full Cost Stack
A license quote answers one question: what the vendor charges for access. It doesn't answer what the firm must spend to make the system work inside billing, finance, client service, and collections.
Include costs beyond the subscription
For a 24-month view, include the subscription, whether priced per user, invoice, account, or transaction. Then add implementation services, integration work, data preparation, workflow design, internal IT and finance hours, training, documentation, change management, and communications.
The transition itself has a cost. Collections may slow while teams learn the new workflow, client records are cleaned, approval rules are tested, and exceptions are routed. That delayed collection effect is an opportunity cost and belongs in the model even if no invoice appears for it.
A practical cost register includes:
- Software subscription: recurring vendor charges under the proposed commercial terms.
- Implementation services: configuration, migration, integration, testing, and project management.
- Internal labor: IT, finance, billing, AR, operations, and partner time allocated to deployment.
- Training and documentation: sessions, process redesign, controls, and user materials.
- Change management: communication, adoption work, governance, and temporary productivity loss.
- Ongoing operations: monitoring, exception handling, reconciliation, reporting, and periodic retuning.
- Opportunity cost: delayed collections or postponed projects during cutover.
For the specified planning model, use implementation at 60% to 100% of the year-one license, internal labor at 40% to 60%, and ongoing operations at 10% to 15% annually. These are scenario inputs, not universal vendor benchmarks. The model should show exactly which assumption drives each amount.
AR Automation Cost Stack Categories | Typical Driver | % of Year-1 License | One-Time vs. Recurring |
|---|---|---|---|
Subscription | Users, invoices, or usage | Contract-specific | Recurring |
Implementation | Configuration and integration | 60%–100% | Mostly one-time |
Internal labor | IT and finance project hours | 40%–60% | Mostly one-time |
Training | Sessions and documentation | Included in project estimate | One-time, with refreshers |
Change management | Communication and adoption | Firm-specific | Front-loaded |
Cutover opportunity cost | Delayed collections | Firm-specific | One-time |
Ongoing operations | Monitoring and exceptions | 10%–15% annually | Recurring |
This is why first-year cost can reach twice the license quote in a realistic planning model. A vendor that shows only subscription cost isn't necessarily being deceptive, but the buyer who accepts that denominator is choosing an incomplete answer.
Payback Period, NPV, and Annualized ROI
Simple ROI tells you whether modeled benefits exceed modeled costs. A CFO still needs to know when the investment recovers cash and whether it earns more than competing uses of capital.
Use the metric that matches the decision
Payback period measures the time required for cumulative net cash benefit to recover the investment. Build a monthly schedule, subtract monthly costs from monthly benefits, and identify the month when cumulative net cash turns positive. A rough shortcut is:
Payback in months = initial investment ÷ monthly net benefit
Use the monthly schedule when benefits ramp gradually. For AR automation, a target of under 18 months is a reasonable decision threshold for the stated framework, but the board should see the assumptions behind it.
NPV discounts future cash flows at the firm's WACC. It answers whether the present value of benefits exceeds the present value of costs. A common planning range for WACC is 8% to 12%, and the rate should come from your finance policy, not from a vendor spreadsheet.
IRR is the discount rate at which NPV equals zero. It helps rank projects with different sizes and timing, but it can mislead when cash flows change direction more than once. Use it as a companion metric, not a substitute for cash recovery analysis.
The table below uses the specified $20M-firm worked scenario, with a 36-month cash-flow schedule showing the stated outcomes.
ROI Metric Comparison for AR Automation | What It Tells You | Best Use Case | Worked Result |
|---|---|---|---|
Simple ROI | Return relative to total cost | Initial profitability screen | 180% |
Payback period | Time until cumulative cash recovery | Risk-sensitive board review | 11 months |
NPV | Present value at the selected WACC | Capital allocation | Calculated at 10% WACC |
IRR | Discount rate producing zero NPV | Ranking investment opportunities | 95% |
Annualized ROI | Time-normalized return | Comparing holding periods | Derive from the schedule |
A result such as 180% ROI, 11-month payback, NPV at 10% WACC, and 95% IRR is useful only when the underlying 36-month schedule is available. The model should show the timing of implementation costs, benefit ramp, recurring operating costs, DSO-related cash release, and recurring savings. For a deeper explanation of recovery timing, use this guide to payback period analysis.
Sensitivity Analysis and Scenario Modeling
A single ROI number is a confession of laziness. It usually means someone selected one DSO assumption, one implementation estimate, and one labor outcome, then presented the result as if operations had no uncertainty.
Build the model, then break it on purpose. The four inputs that usually move the answer most are the DSO reduction realized, the implementation cost, the amount of labor reclaimed, and the speed at which benefits ramp.
Flex the assumptions that control the answer
For DSO, hold the modeled reduction at 15%, 20%, and 25%. For implementation, use low, mid, and high cost cases. For labor, distinguish between partial redeployment and full redeployment. For ramp speed, compare a linear ramp over 6 months with one over 12 months.
Don't combine these inputs casually. A stretch DSO case paired with low implementation cost and immediate labor savings is not a base case. It's an upside case, and the board should see it labeled that way.
The requested matrix should be populated from the firm's own cash-flow schedule. Without the baseline revenue, DSO, license quote, implementation proposal, operating cost, and discount rate, inserting dollar results would create false precision.
Sensitivity Matrix: NPV Across DSO Reduction and Implementation Cost | DSO Reduction | Implementation Cost | Simple ROI | Payback (months) | 5-Year NPV |
|---|---|---|---|---|---|
Conservative | 15% | High | Calculate from model | Calculate from model | Calculate at selected discount rate |
Base | 20% | Mid | Calculate from model | Calculate from model | Calculate at selected discount rate |
Stretch | 25% | Low | Calculate from model | Calculate from model | Calculate at selected discount rate |
Conservative labor | 15% | High | Include partial redeployment | Include ramp | Calculate from model |
Base labor | 20% | Mid | Include planned redeployment | Include ramp | Calculate from model |
Stretch labor | 25% | Low | Include full redeployment | Include ramp | Calculate from model |
Slow ramp | 15%–25% | Low, mid, or high | Delay benefits over 12 months | Recalculate | Recalculate |
Fast ramp | 15%–25% | Low, mid, or high | Delay benefits over 6 months | Recalculate | Recalculate |
Board downside | Lowest realized benefit | Highest cost | Use cash benefits only | Recalculate | Recalculate |
Show the range, not a manufactured forecast
A tornado chart is useful here. Put NPV on the horizontal axis and rank the impact of DSO reduction, implementation cost, labor redeployment, ramp speed, bad-debt avoidance, and fee savings. The longest bar is the lever that deserves the most diligence before signing.
If DSO reduction dominates the chart, validate invoice delivery, dispute resolution, client segmentation, and escalation workflows. If implementation cost dominates, request fixed deliverables, acceptance criteria, and a clear internal resource plan. If labor redeployment controls the result, get the department heads to sign off on what people will do with the reclaimed capacity.
Board standard: Every case needs an assumption log beside it. If an assumption can't be owned by a person, reconciled to a system, or tested after launch, don't treat it as committed value.
The finance-team checklist before a vendor conversation is short:
- Baseline DSO: Use a trailing average and defined collection scope.
- Aging buckets: Identify concentration and overdue dollar exposure.
- Collections labor: Include AR, billing, operations, and dispute work.
- Write-off rate: Reconcile the GL and separate credits from bad debt.
- Software cost: Capture the full commercial structure.
- Implementation cost: Include integration, migration, testing, and support.
- Ongoing operations: Budget monitoring, exceptions, reconciliation, and retuning.
- Benefit ramp: Model both 6-month and 12-month linear paths.
- Discount rate: Use the firm's approved WACC.
Three errors deserve immediate rejection. First, don't count gross invoice value as recovered cash. Count cash collected earlier or losses avoided. Second, don't ignore ramp time. A system that produces value only after adoption can't support a month-one payback claim. Third, don't double-count labor savings against fee reductions when the same process change drives both assumptions.
Your operating model should also show whether the proposed platform fits the systems your team already uses. Workflows that connect billing, finance, client-service, and communication tools deserve more scrutiny than standalone reminder features. Teams evaluating agent integrations for teams can use that perspective to assess whether automation will operate inside existing processes rather than create another disconnected queue.
For firms comparing AR software for professional services, QuickBooks AR automation, or broader accounts receivable automation, the decision should end with an auditable model. Resolut can operationalize that model through automated outreach, payment workflows, risk identification, cash application, and human-in-the-loop controls. The platform belongs in the evaluation as an operating option, not as a reason to lower your evidentiary standard.
Any ROI claim outside the sensitivity envelope is a red flag, not a feature. Ask the vendor to map every claimed benefit to a baseline metric, a cash-flow line, an owner, and a measurement date. If they can't, the number isn't ready for the board.
Resolut automates AR for professional services with consistent, accurate, and human workflows across collections, payment follow-up, and cash application. Build your baseline, pressure-test the assumptions, and visit Resolut to see how the operating model can be put into practice.