Credit Risk Management Dashboard Guide for Finance Leaders
Build a credit risk management dashboard that protects cash flow. Learn core KPIs, layout best practices, and how to put early warning signals to work.
On Tuesday morning, the CFO of a professional services firm opens the AR aging before the 9:00 standup. One client has moved from paying 45 days after invoice to 78 days past terms. The account manager still says the relationship is strong, the delivery team is still working, and the balance is large enough to affect the month.
That's how bad debt starts in many firms. Not with a dramatic default, but with quiet payment drift that nobody owns until the receivable becomes a write-off conversation.
A credit risk management dashboard gives finance leaders one working surface for exposure, payment behavior, delinquency, and action. Used properly, it helps you reduce DSO, protect margins, and improve cash flow without turning every client conversation into a confrontation.
What a Credit Risk Management Dashboard Does
A credit risk management dashboard turns scattered receivables data into a decision-ready view. It brings together customer exposure, overdue balances, payment patterns, credit limits, and risk signals so the finance team can see where attention is required before an account becomes uncollectible.
That makes it different from a standard AR aging report. An aging report records what is already overdue. A working dashboard also identifies which accounts are drifting, which customers are consuming more of their approved exposure, and which risks need an owner today. For a professional services firm, that means finance can decide whether to keep work moving, change terms, or involve the account partner before delivery exposure grows.
The dashboard is a control surface
A report documents the past. A control surface drives the next decision.
For each material customer, the dashboard should answer four questions:
- How much are we exposed to this customer? Include invoiced AR, unbilled work where relevant, approved credit, and committed delivery exposure.
- Is the account deteriorating? Show late-payment trends, overdue invoices, disputes, broken promises, and changes in external credit information.
- What credit decision is required? The finance leader may need to reduce a limit, pause new work, request a deposit, or approve an exception.
- Who acts next? Assign the collection owner, escalation date, sales contact, and required follow-up directly from the risk view.
This creates ownership rather than another report to circulate. When a client crosses a policy threshold, the Controller should not have to search email to find out whether the account manager knows. The dashboard should show the trigger, name the owner, and record the next action.
On a Tuesday, that may mean approving a deposit before a new engagement starts, asking a partner to call a slow-paying client, or placing a hold on additional work. The value is practical: every signal connects to a finance decision.
What belongs above the fold
The top of the screen should show total exposure, overdue AR, the largest customer exposures, the watchlist count, and the latest threshold breaches. A CFO needs the portfolio position first, followed by the accounts most likely to change it.
The view should support drill-downs by service line, geography, partner, customer segment, and account owner. A large balance from a long-standing client may call for a different response than a smaller account with rapidly worsening payment behavior.
Credit dashboards have developed beyond isolated scorecards. A 2016 SAS conference paper described dashboards that display risk indicators at a glance and support drill-downs by exposure, region, and sector, alongside probability of default, ratings, transition matrices, tail risk, concentration, and provisions. Oracle's financial-services documentation describes 300+ pre-built credit risk reports and dashboards across retail, wholesale, and counterparty risk. That shows how established integrated risk oversight is in banking. The evolution of credit risk dashboards points to a principle professional services firms can apply without copying bank complexity: centralize the signals, define the response, and make deterioration visible early.
From Exposure to Default: The Variables That Drive the View
On Tuesday afternoon, a partner asks whether the firm can accept another project from a client with unpaid invoices. The answer should come from the dashboard's exposure view, not from a last-minute spreadsheet or a reassuring customer history.
Start with total credit exposure. This is the amount your firm could lose if a customer stopped paying. In professional services, it can include invoiced receivables, approved but unused work, unbilled time, reimbursable costs, and contractual commitments. The exact perimeter depends on the engagement model. Make that perimeter explicit, so finance, delivery, and account owners are reviewing the same risk.
Review concentration alongside exposure. A portfolio can look healthy in aggregate while one customer, sector, or geography determines the outcome. As a practical policy, any single customer above 10% of total AR warrants a named review rather than an anonymous line in a report. That review should answer a direct question: can the firm accept more delivery, or should it limit additional commitments?
The risk variables in plain English
Probability of default, or PD, estimates the likelihood that a customer will fail to meet its obligations over a defined period. Your team influences PD through payment terms, deposits, milestone billing, credit holds, and the decision to continue work while invoices remain unpaid. For a deeper comparison of scoring approaches, see our guide to credit risk assessment tools.
Exposure at default, or EAD, estimates how much will be outstanding if default occurs. A customer may have moderate PD but dangerous EAD when the firm keeps delivering work, carrying expenses, and issuing invoices while payment slows. The Tuesday decision is whether to reduce future commitments before the balance grows.
Loss given default, or LGD, estimates what will not be recovered after default. Strong contracts, retainers, enforceable acceptance terms, deposits, and a disciplined stop-work policy can reduce LGD. Weak documentation and disputed scope tend to increase it. Finance should use this measure to identify where commercial controls need attention.
Expected credit loss connects these variables to the P&L. It turns a credit policy question into a reserve and forecasting question. The dashboard should not make the accounting judgment for you. It should show which accounts and exposures are driving the estimate, so you can explain changes to management and the board.
Oracle's documented credit-risk calculations include delinquency ratio, weighted average default rate, and NPA ratio. Its dashboard guidance also identifies outstanding balance, account counts, loan-to-value, credit-rating distribution, and expected loss as useful measures. Oracle's credit risk management documentation shows how these measures support operational credit oversight.
Why the variables belong together
A customer with high exposure and stable payments may be acceptable. A customer with low exposure but rapidly worsening payment behavior may require immediate intervention. The dashboard earns its place by showing the relationship between size, likelihood, recoverability, and movement.
Variable | What It Measures | Finance Leader Action |
|---|---|---|
Total exposure | Amount currently at risk across billed and committed work | Set the review population and compare exposure with approved limits |
Concentration | Share of AR tied to one customer, segment, or geography | Name an owner and review whether exposure is acceptable |
PD | Likelihood of default over a defined horizon | Tighten terms, request security, or place the account on watch |
EAD | Expected balance outstanding at default | Stop uncontrolled delivery and reduce future commitments |
LGD | Portion unlikely to be recovered after default | Improve contracts, deposits, documentation, and escalation |
Expected credit loss | Estimated loss connecting risk to reserves | Test provisions and explain movement to the board |
Arrange the widgets around the decisions. Put total exposure and concentration at the top, risk movement beside them, and customer-level detail beneath. The screen should take a finance leader from “how much?” to “why?” to “what action?” without another spreadsheet export.
Core KPIs and Early Warning Indicators That Matter
A dashboard earns its place on Tuesday morning, when a CFO must decide whether to press a client for payment, pause new work, or accept additional exposure. Keep the weekly view short enough to use and strict enough to change behavior. Build a chain of signals that starts with payment behavior, confirms deterioration through aging, and directs attention according to exposure.
DSO is the first directional measure. Set a working target, such as keeping DSO under 45 days, and investigate a weekly drift above 5 days instead of waiting for month-end reporting. DSO does not identify every cause, but its movement shows whether the collection process is gaining or losing control.
Aging confirms what the trend may conceal. Track AR over 60 days and 90 days, with a policy flag when the 60-plus balance exceeds 15% of total AR. Pair those buckets with the percentage of AR past due. A stable DSO can still hide a concentrated pocket of severely overdue invoices, especially in a professional services firm where a few large engagements dominate receivables.
The weekly operating shortlist
- Bad debt write-off rate: Review movement against policy. Trace write-offs to weak onboarding, poor scope control, unresolved disputes, or collection delays, then assign the corrective action.
- Customer concentration ratio: Alert when one customer passes 20% of open exposure. Give that relationship an explicit liquidity and account-management plan.
- Credit limit utilization: Review customers at 75% of approved limit, and investigate further utilization before the account reaches its ceiling.
- Payment promise breaches: Treat a broken promise as an event, not a note. Escalate it in the same week and record the owner.
- Average days late: Trigger review when the measure rises 10 days month over month. A change in payment pattern often appears before a severe aging shift.
- Repeat short payments: Separate legitimate deductions from recurring underpayments. A customer who repeatedly pays less than agreed needs an owner and a resolution date.
These thresholds are operating policies, not universal laws. Set them before pressure arrives, then adjust them for client mix, contract structure, and margin profile. A threshold without an assigned response is only a label on a chart.
Early-warning indicators need equal attention. Increasing payment delays, repeated overdue invoices, growing AR aging, requests for extended terms, rising utilization, and deteriorating external credit information may precede a formal default. Receivables monitoring should combine overdue balances, disputed invoices, payment-pattern changes, and customer exposure rather than relying on aging alone, as outlined in Emagia's guide to credit risk monitoring.
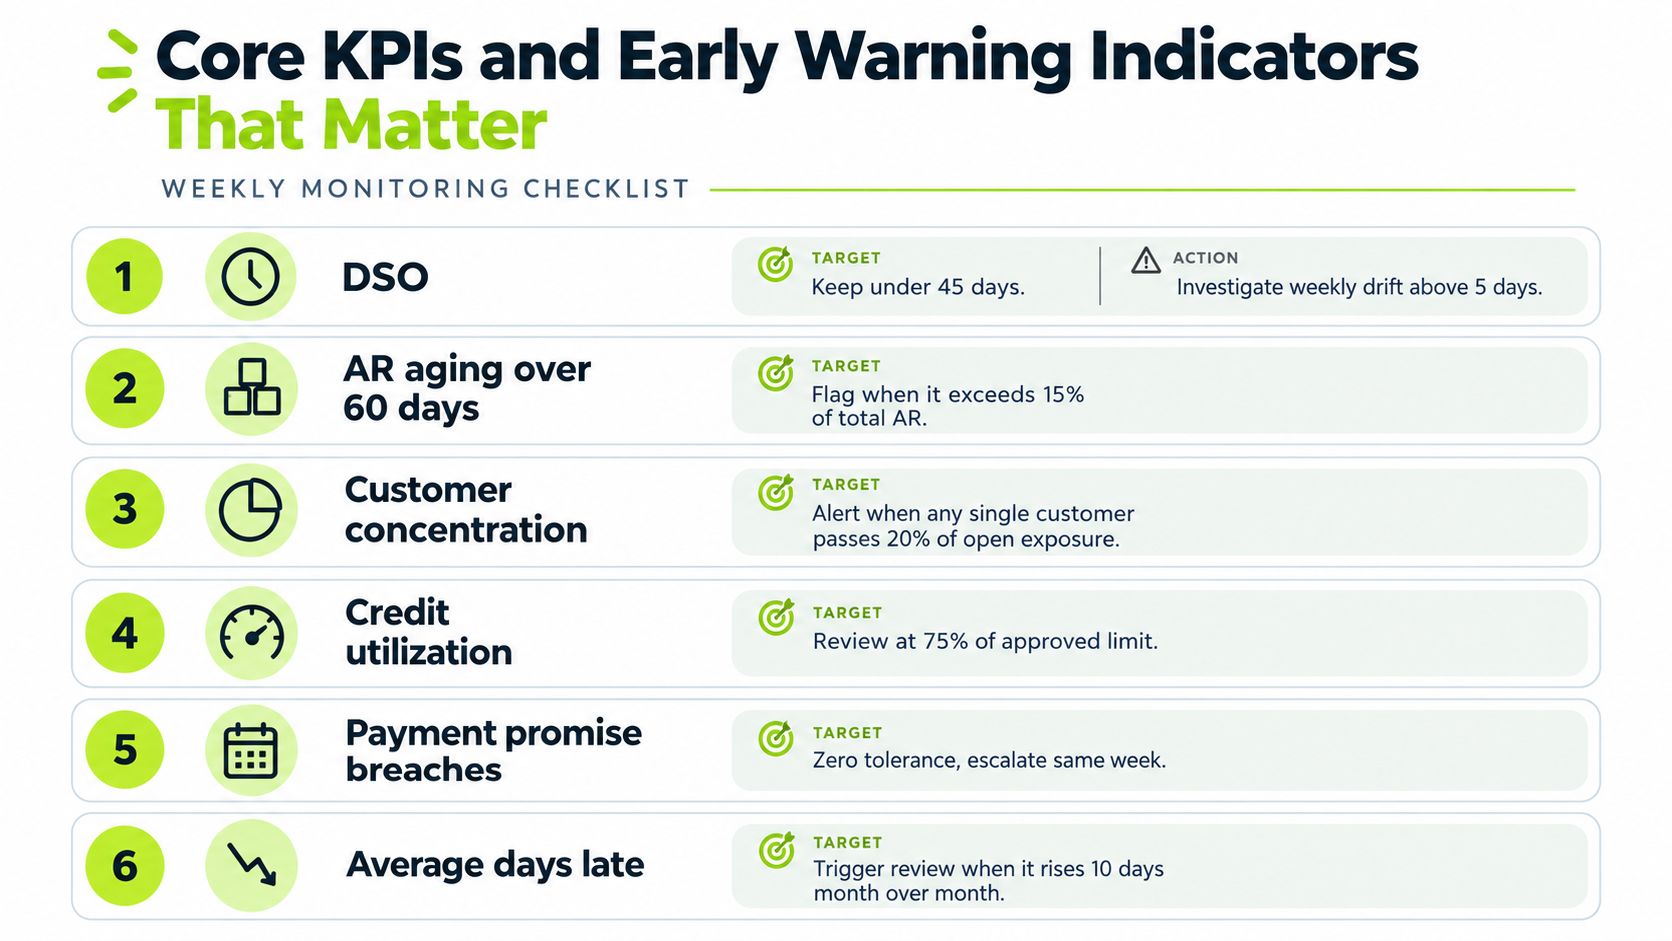
Each KPI should support a Tuesday decision. DSO shows whether collection performance is drifting. Aging shows where cash is stuck. Concentration identifies the relationship that can affect liquidity most. Utilization shows whether new work is increasing risk. That is the difference between AR software for professional services and a polished report.
For firms using predictive methods, credit risk analysis using machine learning can add a forward-looking signal when the underlying data is clean and the team knows what action each alert requires. Technical dashboards should track PD, LGD, EAD, delinquency or NPL rates, and roll rates together, following the same discipline described in actionable infrastructure dashboards. KS and AUC help monitor whether model predictive power remains stable over time.
The collection workflow must connect to the signal. If an account crosses a threshold but no task, owner, or escalation path appears, the dashboard remains passive. Assign the response before the alert reaches production.
Layout Design and Widget Examples for Real Decisions
A finance leader opens the dashboard on Tuesday morning after a client misses a promised payment. The first screen should show whether that issue is isolated, spreading across a service line, or adding pressure to the firm's cash position. Design the view around that decision, then lead the user to the account and owner responsible for the response.
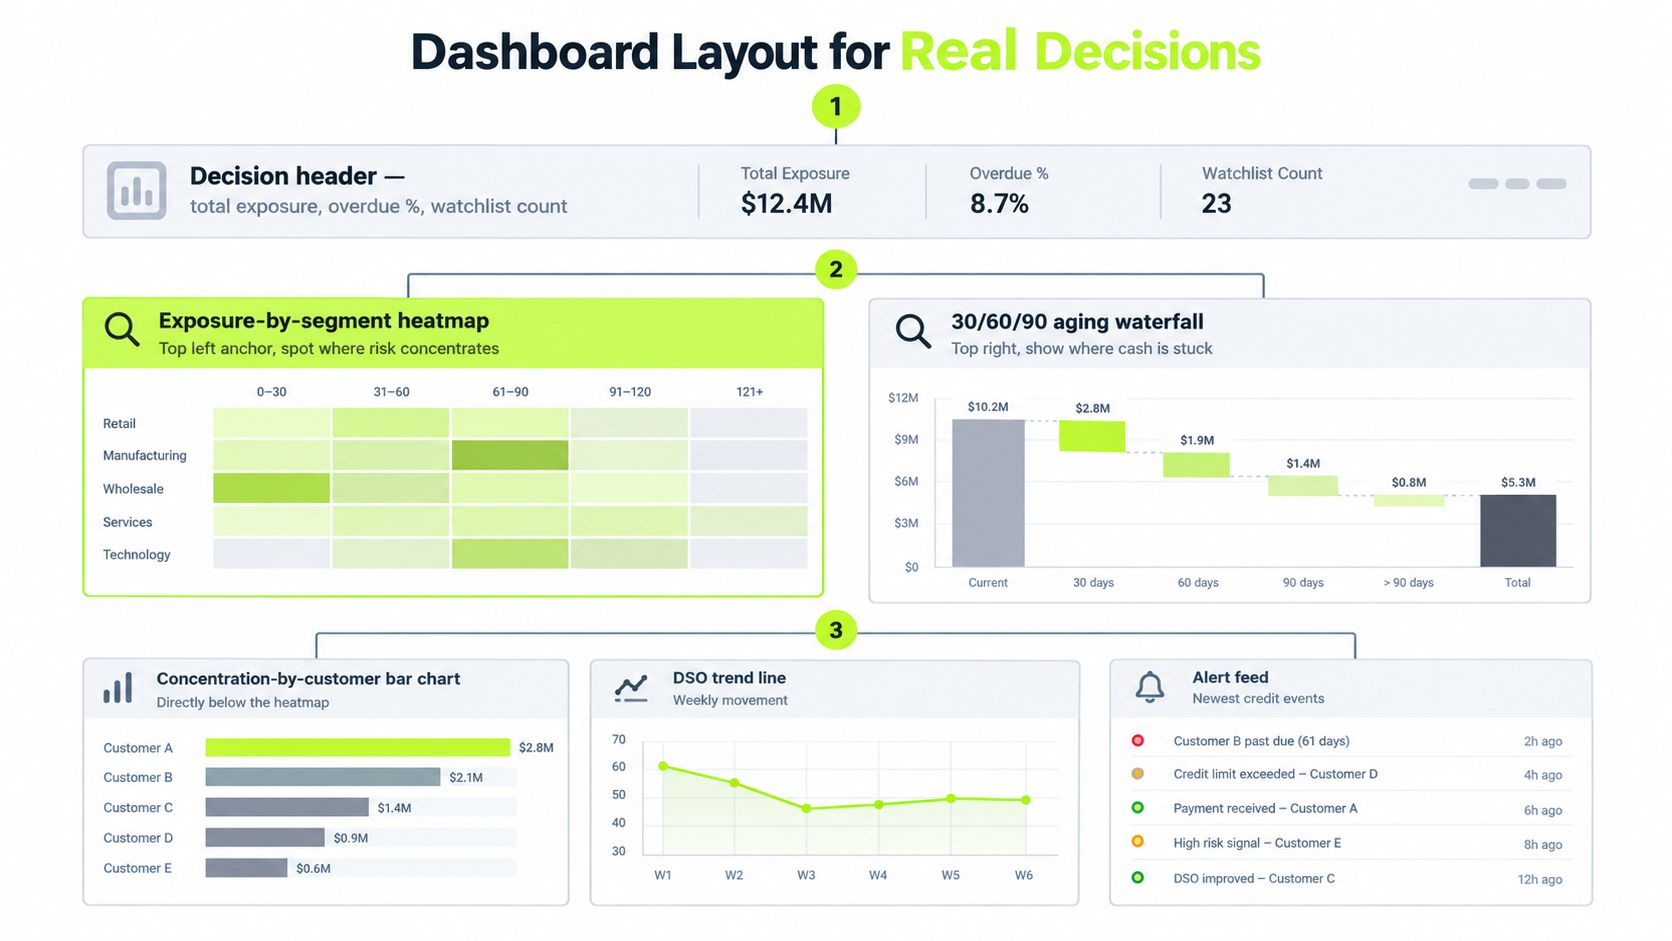
Place an exposure-by-segment heatmap in the top-left position. Use service line, customer tier, industry, or geography as the dimensions. A professional services CFO can then see whether exposure is building in one practice area or client group before a single large account dominates the discussion.
Put a 30/60/90 aging waterfall in the top-right position. Show how receivables move from current into older buckets and where cash conversion is deteriorating. Set an amber flag when AR over 60 days crosses the policy threshold defined in the KPI section, then route the underlying accounts to the collection owner.
Build the screen around reading order
Directly under the heatmap, add a concentration-by-customer bar chart. Escalate the top customer exposure to red when it crosses the concentration threshold defined in the KPI section, based on your internal policy. Under the aging waterfall, place a DSO trend line and an alert feed showing the newest credit events.
The supporting widgets should follow this reading order:
- Decision header: Total exposure, overdue AR, watchlist count, and current policy breaches.
- Aging waterfall: Current, 30-plus, 60-plus, and 90-plus balances.
- Exposure heatmap: Risk concentration by segment, geography, or service line.
- Customer concentration chart: Largest balances ranked by share of open exposure.
- Credit utilization gauge: Approved limit compared with current and expected exposure.
- Watchlist table: Customer, owner, last payment date, risk band, and next action.
- Trend line: 90-plus balances compared with policy limits over time.
- Alert feed: New late payments, broken promises, disputes, limit breaches, and external credit changes.
This order supports distinct Tuesday decisions. A CFO can scan the header, inspect aging and concentration during the weekly review, and use the watchlist to direct the team. A Controller can return to the alert feed during the day. A credit analyst can work from customer-level drill-downs, checking the invoices, commitments, and assigned actions behind each exception.
Use restrained color. Green should mean within policy, amber should mean review, and red should mean a defined escalation. Do not use red for every overdue invoice. If every exception looks urgent, the team will stop separating a routine collection task from a material credit event.
A short visual can reinforce the operating model: a finance leader reviewing the dashboard beside an aging report, with one customer row highlighted and the next action already assigned. The message is control and context, not futuristic automation.
Preserve the underlying records behind every visual. Each alert needs a timestamp, the rule that fired, the data that caused it, the person who reviewed it, and the action taken. That history turns the dashboard from a meeting aid into a usable audit trail and a basis for policy review.
Data Integration and Architecture Behind the Dashboard
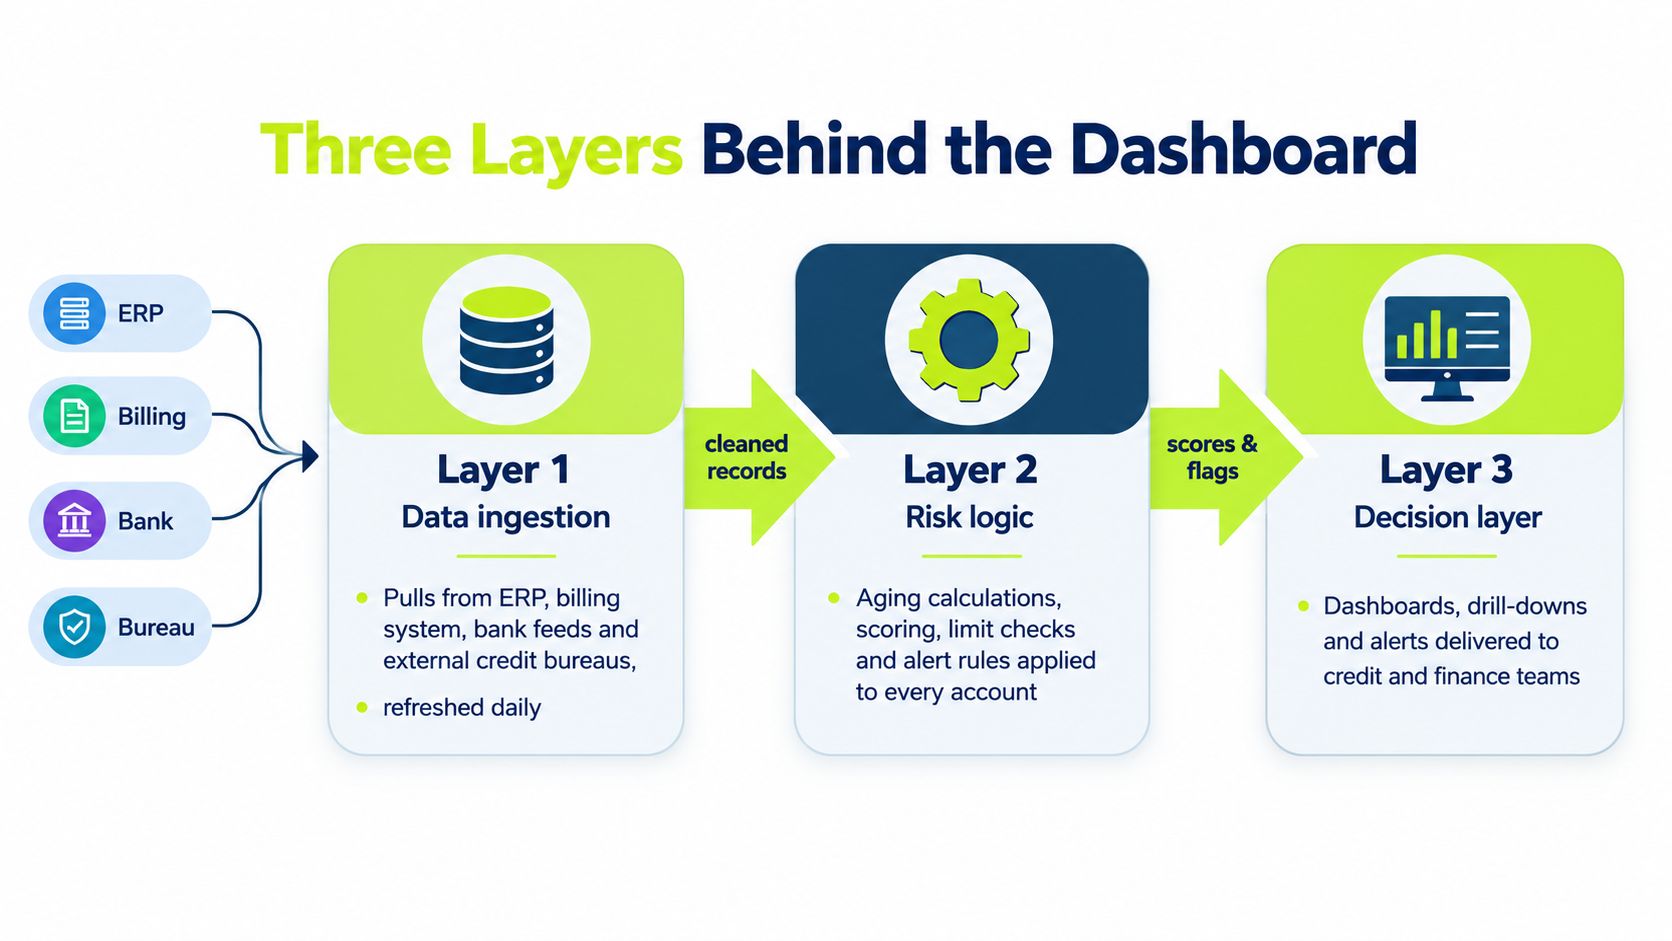
A credit risk management dashboard is only as dependable as the data pipeline beneath it. Controllers should evaluate the architecture in three layers: ingestion, risk logic, and decision delivery.
Layer one is data ingestion. The system pulls customer, invoice, payment, and commitment data from the ERP, billing system, bank feeds, and external credit bureaus. For a professional services firm, project accounting and time-and-expense systems may also matter because unbilled work can increase exposure before an invoice exists.
Layer two is risk logic. This layer standardizes payment terms, calculates aging, identifies concentration, checks credit limits, updates risk scores, and applies alert rules. The calculations can run nightly or close to real time, but the refresh expectation must be explicit. A dashboard that looks current while relying on stale customer records creates false confidence.
Layer three is the decision layer. A BI tool or finance platform displays the metrics through dashboards, drill-downs, alerts, and workflow tasks. The best presentation layer doesn't merely show that a customer is late. It shows the invoice, the owner, the policy rule, the recommended action, and the date by which someone must respond.
Build or buy requires an honest tradeoff
A custom build gives your team control over credit policy logic, data definitions, and unusual engagement structures. It also creates responsibility for maintenance, testing, security, documentation, and every future change to the ERP or billing process.
A pre-built platform can shorten time to value and provide proven connectors, standard metrics, and workflow controls. It may require your team to adapt some processes to the product's model. That tradeoff is usually acceptable when the alternative is a spreadsheet assembled manually each week.
Controllers often underestimate three integration problems:
- Customer master data: Duplicate legal entities and inconsistent account names can split one exposure across several rows.
- Payment terms: Different terms across entities or contracts can make the same aging bucket mean different things.
- External refresh cadence: Credit-bureau data may update on a different schedule from internal payment data, so users need to see the source and timestamp.
Data governance should define the owner of every field, the approved calculation for every KPI, and the process for correcting an exception. Preserve source records, calculation versions, alert history, and approval notes. A dashboard becomes a finance control when another person can reproduce why an account was flagged and what the team did about it.
User Personas and Workflows That Bring the View to Life
The same dashboard should serve different users without giving each person a separate version of the truth.
At 8:30 on Tuesday, the CFO opens the executive summary. The first questions are practical: Which customers represent the largest exposure? Has overdue AR moved outside policy? Does the firm need to protect liquidity before the next payroll or consider a line-of-credit draw?
The credit analyst works differently. They open the aging waterfall, select the 60-plus bucket, and sort by exposure, payment delay, and owner. They review the latest invoice history, confirm whether a dispute is genuine, and trigger a collection note or credit hold review through the AR system.
The Controller uses the breach log. They validate policy exceptions with the sales lead, check whether promised actions happened, and update the credit committee pack. The Controller is not just checking numbers. They're testing whether the firm followed its own decision rules.
Persona | Primary Widgets | Key Question Answered | Action Taken |
|---|---|---|---|
CFO | Decision header, concentration chart, DSO trend | Could one customer or segment disrupt liquidity? | Set escalation priority, approve a limit change, or discuss funding |
Credit analyst | Aging waterfall, watchlist, payment history | Which account needs intervention today? | Contact the customer, record the outcome, and start the defined workflow |
Controller | Breach log, policy limits, audit history | Did the team apply policy consistently? | Validate exceptions, assign remediation, and prepare management reporting |
A workflow that closes the loop
The operating sequence should be visible:
- Alert: A metric or behavior crosses a defined rule.
- Triage: The owner checks the invoice, contract, dispute, and payment history.
- Decision: Finance chooses collection escalation, credit hold, revised terms, deposit, or approval.
- Follow-up: The system records the commitment, date, owner, and result.
- Review: The next meeting confirms whether risk reduced or requires further action.
This workflow prevents a common failure: the dashboard identifies a problem, but nobody changes the customer's treatment. A client who misses one payment may need a reminder. A client who repeatedly pays late while requesting more work needs a credit decision.
For professional services, the sales and delivery teams must see the relevant action without owning the credit policy. The CFO sets the risk appetite, the Controller maintains the rules, and the collection owner executes the response. The dashboard keeps those responsibilities connected.
Implementation Checklist and Putting It to Work With Resolut
Start with the decision, not the software. Decide which Tuesday-morning questions the dashboard must answer, then select the minimum data and workflow needed to answer them consistently.
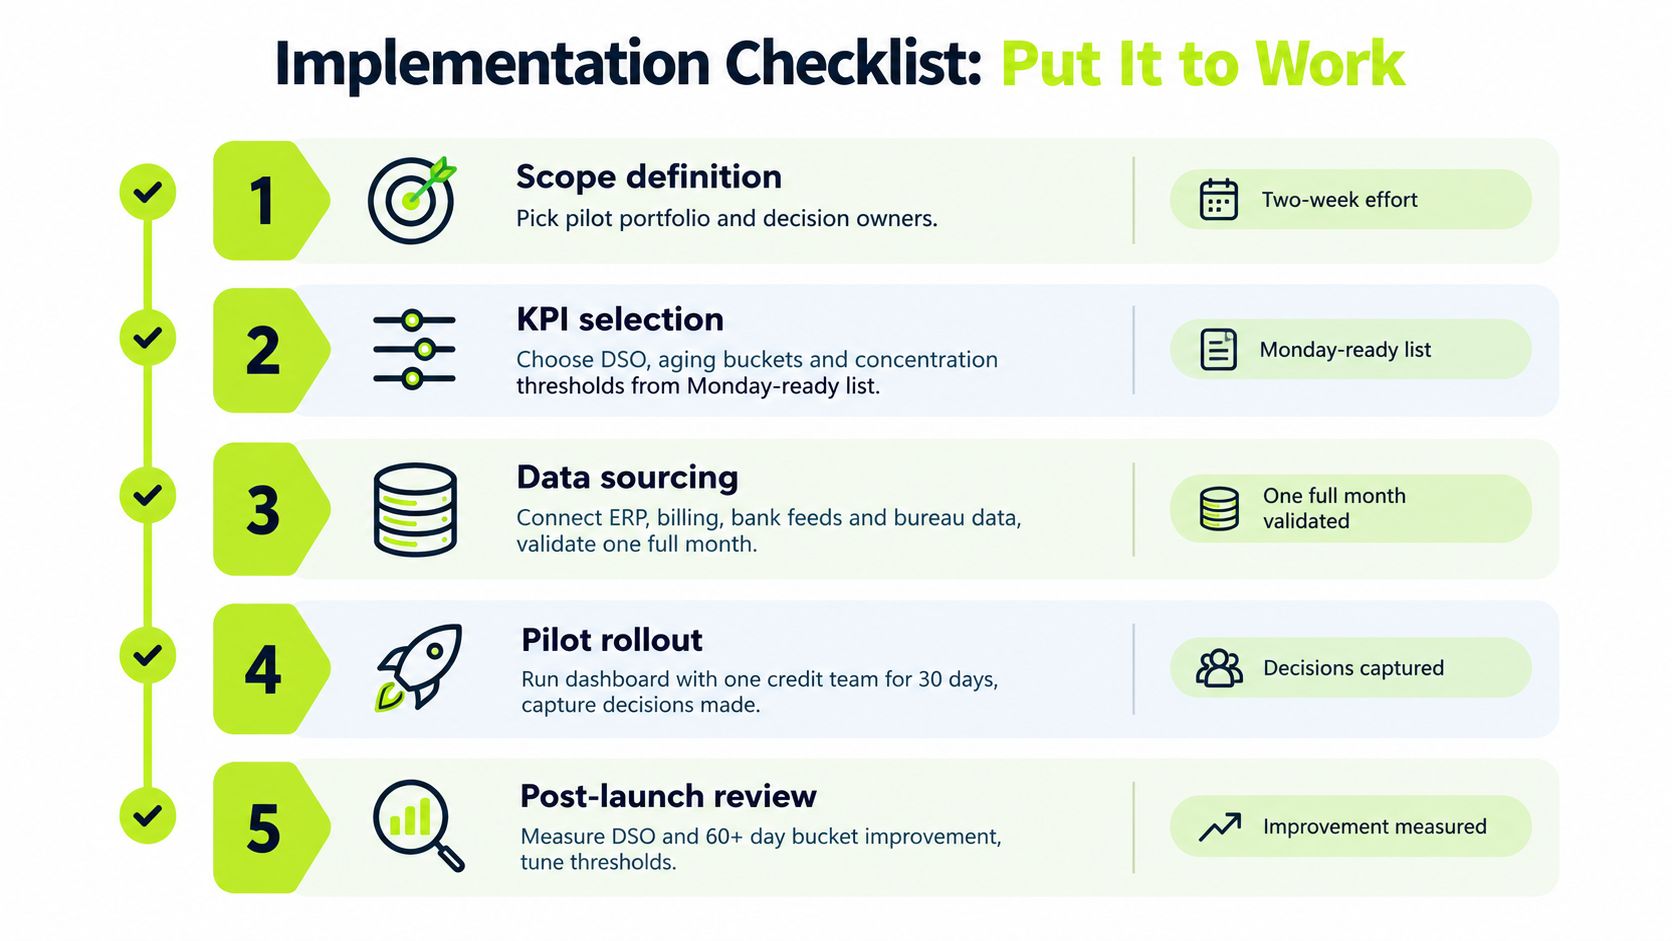
A practical rollout sequence
Scope definition: Pick one pilot portfolio, define the decision owners, and document what counts as exposure. Include billed AR, unbilled work, reimbursables, or committed delivery only when your policy says they belong in the risk view.
KPI selection: Begin with DSO, aging buckets, past-due AR, concentration, credit utilization, payment promises, and average days late. Set the thresholds before the pilot starts so the team can evaluate whether alerts create useful action.
Data sourcing: Connect the ERP, billing system, bank feeds, and relevant external credit information. Reconcile one complete period of records, remove duplicate customers, and test payment terms across entities.
Pilot rollout: Run the dashboard with one credit or collections team for 30 days. Record which alerts led to decisions, which alerts were noise, and where the data required manual correction.
Post-launch review: Compare DSO movement and the 60-plus-day bucket with the firm's policy objectives, then tune thresholds. The review should also examine ownership, follow-up completion, disputed invoices, and the quality of the audit trail.
The right accounts receivable automation layer should consolidate AR aging, payment behavior signals, counterparty exposure, and collection workflows without forcing a rip-and-replace of the ERP. That matters for professional services firms because the ERP may remain the system of record while finance needs a more usable operating layer on top.
A platform such as Resolut can fit that role by bringing risk and AR activity into one view, supporting customer risk review, automated outreach, payment workflows, and cash application. It can support AI AR automation and QuickBooks AR automation use cases when those workflows are connected to the firm's actual customer and invoice records, rather than treated as a separate reporting exercise.
Keep the architecture maintainable. Snowflake debt management strategies offers useful context for thinking about the long-term cost of brittle risk-control systems, especially when custom logic accumulates without clear ownership. For a broader view of the operating model, credit risk management solutions can help finance leaders compare the capabilities required across assessment, monitoring, collections, and escalation.
The outcome you want isn't a dashboard that looks impressive during a board meeting. It's a Tuesday workflow where the CFO sees exposure, the Controller confirms policy, the analyst acts on the right account, and the client conversation happens while recovery is still practical.
Resolut automates AR for professional services with consistent, accurate workflows that keep payment behavior, credit attention, and collections action connected. If you want to reduce DSO and improve cash flow without losing the human judgment behind client relationships, visit Resolut to see how it can support your operating model.