What Is Payback Period and How Finance Teams Use It
Learn what is payback period, see the formulas, worked examples, and Excel setup. Discover how finance and AR teams use it to speed cash flow.
You're staring at two numbers that compete for the same cash. One is a software project that could improve operations. The other is a stack of overdue invoices that should already have turned into cash, but hasn't.
That's the practical version of what is payback period. It's not academic first, it's practical. Finance leaders use it to ask one blunt question, how long until the business gets its money back?
For CFOs, controllers, and owners in professional services, that question shows up everywhere. A billing system upgrade, a collections change, a new workflow tool, all of them compete for capital against cash already trapped in accounts receivable. Payback period gives you a single timing lens to compare those choices without pretending they're all the same kind of investment.
The Cash Flow Question Every Operator Asks
A mid-sized services firm rarely has a clean capital queue. A partner wants a better client portal, the ops lead wants new billing software, and the finance team is still chasing invoices that should've cleared weeks ago. The conversation is never just about the cost, it's about how long cash stays tied up before it comes back.
That's where payback period earns its keep. It turns the investment debate into a time question, not a valuation contest. A project with a faster recovery window usually feels safer when working capital is tight, even if it isn't the highest-return option on paper.
The operator's version of the question
The classroom answer is simple, and the practical version is even simpler, how quickly does cash come back to the business? If a firm is deciding between a $250,000 software spend that improves service delivery and $180,000 sitting in overdue invoices, payback thinking makes both visible on the same clock. The comparison isn't about elegance, it's about liquidity risk and timing.
That's why the metric stays useful even when everyone in the room knows it doesn't tell the full profit story. It tells you when the cash cycle closes. For firms that run on billable work, milestone billing, and client follow-up, that matters more often than finance textbooks admit.
Practical rule: if two decisions affect cash differently, payback period is one of the fastest ways to see which one returns working capital sooner.
The metric is also easy to explain to non-finance leaders. A partner doesn't need an NPV lecture to understand “we get the money back in X years.” That simplicity is why it stays on the table in operating meetings, especially when cash discipline matters more than theoretical precision.
The Payback Period Formulas You Need
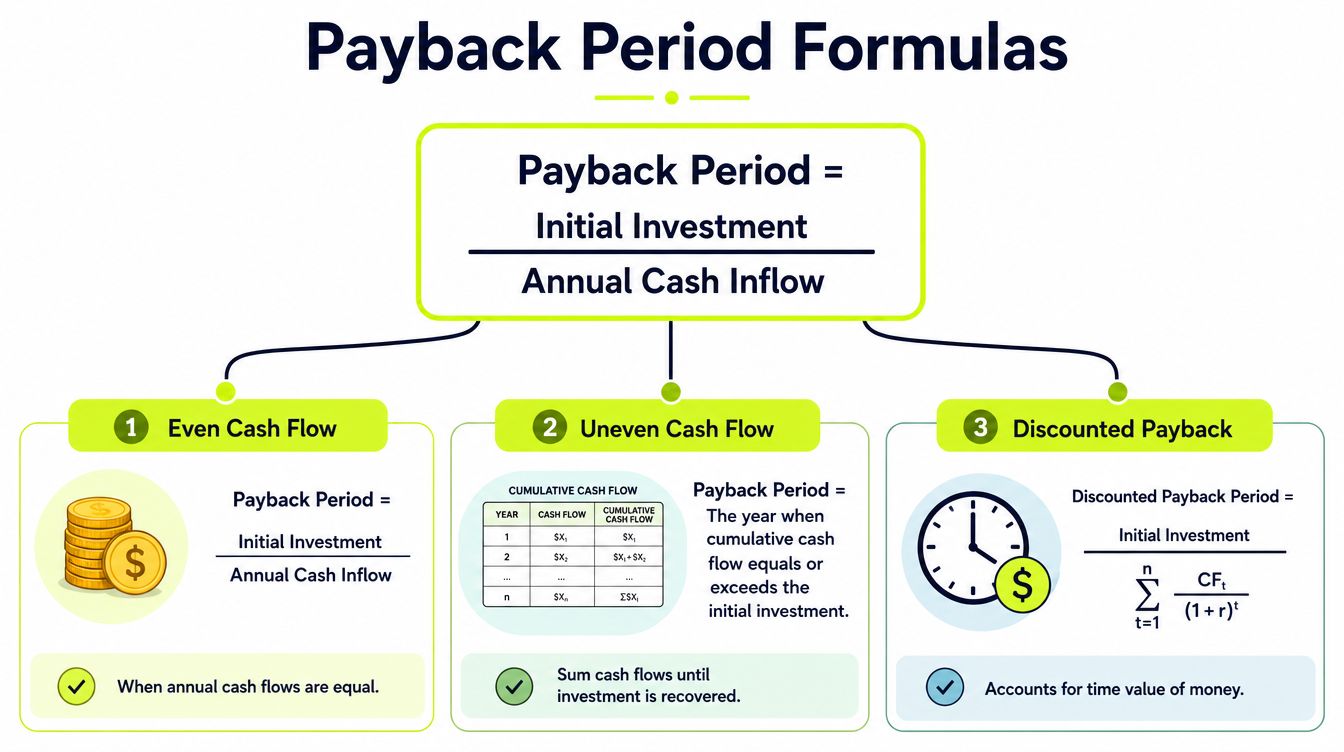
The base formula is the one finance teams use for steady cash flows. Initial Investment ÷ Annual Cash Flow gives you the number of years it takes to recover the outlay when inflows are predictable. That is the clean classroom version, and it works well when the cash profile is even enough that you do not need to force precision the business does not have.
For a more finance-aware view, use discounted payback. PMI's project management library notes that the discounted version folds in the time value of money, which matters more when discount rates are higher or cash lands unevenly over time, because a dollar received later is not the same as a dollar received now. The logic is simple, future cash should be treated as less valuable than immediate cash. That makes the metric more disciplined when financing costs matter. PMI's discussion of discounted payback is a useful reference point for that distinction.
How to handle uneven cash flows
When the inflows are not perfectly level, use the more precise version: years before break-even + (unrecovered amount ÷ cash flow in the recovery year). Wall Street Prep lays out that uneven-cash-flow approach clearly, and it is the version to use when receipts vary across quarters or when the recovery year only partly closes the gap. Wall Street Prep's payback calculation guide is useful for that fraction-of-year adjustment.
If you need a clean definition of net cash flows, keep the input discipline tight. Payback only works when the inflows and outflows are stated on the same cash basis, because the formula is only as good as the cash number you put into it.
What the formula is really measuring
Payback period is a break-even timing measure, not a profitability measure. Calculator.net states the distinction plainly, cumulative cash inflows equal cumulative cash outflows at the break-even point, but that does not tell you whether the project creates value beyond that point. Calculator.net's payback period explanation captures the core limitation well.
The practical use is cash discipline. You get a fast read on how long capital stays exposed, which is useful when a CFO needs to compare projects that tie up liquidity in different ways. It also explains why the metric shows up in working-capital conversations, where the question is often less about maximum return and more about how long cash remains trapped before it comes back.
Two Worked Examples You Can Replicate Today
The fastest way to make payback period useful is to run it on a deal you'd sign. One even-cash-flow case shows the clean version of the math. A second, uneven case shows where the fraction-of-year adjustment matters.
Example one, even annual cash flow
A firm considers a $100,000 client billing upgrade. The system is expected to create $25,000 of annual net cash flow from faster billing and fewer manual errors.
Using the standard formula, Initial Investment ÷ Annual Cash Flow = Payback Period.
That becomes $100,000 ÷ $25,000 = 4 years.
The interpretation is direct. The business gets its capital back in four years, and only after that does the project move from recovery to surplus. That's a decent screening answer when the inflow is steady and the decision depends on how long cash stays exposed.
Example two, uneven recovery timing
Now look at a professional services workflow project with irregular quarterly receipts. The firm spends $250,000 up front, then receives cash unevenly through the year as clients adopt the new process. Assume the cumulative inflows don't fully recover the investment until partway through the final recovery year.
The proper method is to total the full years before break-even, then add the fraction of the final year using unrecovered amount ÷ cash flow in the recovery year. If $40,000 remains unrecovered and the recovery year produces $80,000 of cash flow, the fraction is 0.5 of a year. If two full years passed before that point, the payback period is 2.5 years.
That's the version I trust when cash arrives in chunks instead of equal instalments. It prevents a false sense of precision from a rounded annual average.
How discounted payback changes the answer
Discounted payback will usually push recovery later than simple payback because it gives less credit to cash that arrives farther out. That's useful when rates are high or the project back-loads its benefits. The choice isn't about sophistication for its own sake, it's about whether time and financing cost are material to the decision.
A good habit is to calculate both. Simple payback gives you the operational view. Discounted payback tells you what the recovery looks like once money has a cost attached to it.
Excel and Google Sheets Setup That Saves Hours

A payback model doesn't need to be complicated. In both Excel and Google Sheets, the cleanest setup is a small input block, a cash flow table, and a single output cell that tells you whether the project clears your hurdle.
A simple sheet structure
Put Initial Investment in B2, Annual Cash Flow in B3, and Hurdle Payback in B4. Then use:
- Simple payback:
=B2/B3 - Hurdle check:
=IF(B5<=B4,"Meets hurdle","Misses hurdle")
If your cash flows are uneven, build a row for each period, then add a cumulative cash flow column. The break-even point is the first period where cumulative cash flow turns positive. For the partial-year fraction, use the unrecovered balance divided by the cash flow in the recovery period.
A discounted version that actually works
For discounted payback, add a discount rate cell, and anchor it with absolute references so the formula doesn't drift when you copy it down. Each period should have a discounted cash flow line, then a cumulative discounted cash flow line.
The key errors are predictable. Teams mix percentages and decimals, so 10% becomes 10 instead of 0.10. They also forget to lock the discount rate cell, which breaks the model when they fill formulas across multiple rows. That's the kind of spreadsheet error that turns a useful screen into nonsense.
If you want a practical lens on how invoicing and collections workflows affect the model inputs, invoice automation explained is a useful read. It helps connect process design to the cash flow numbers that end up in the sheet.
A reliable model should answer one thing fast, how long until the cash returns. If it takes more than fifteen minutes to build the first version, the sheet is too complicated.
How to Interpret the Number Without Fooling Yourself
Historically, payback period has been one of the most widely used capital appraisal methods because it is blunt and intuitive. A survey review reports 59.2% usage in one classic study, 67% in another, and 78.1% in a 2003 Sweden survey. The same review reports common managerial hurdle targets clustered around 2 to 4 years, with average hurdles of 2.91 years in one U.S. survey, 2.9 years in a U.K. survey, and 2.83 years for conventional projects versus 3.11 years for new-technology projects. The survey review shows how durable the method has been in practice.
Those numbers matter because they tell you how operators use the tool. They don't use payback period as a full valuation model. They use it as a gatekeeper for liquidity and risk.
What it tells you, and what it misses
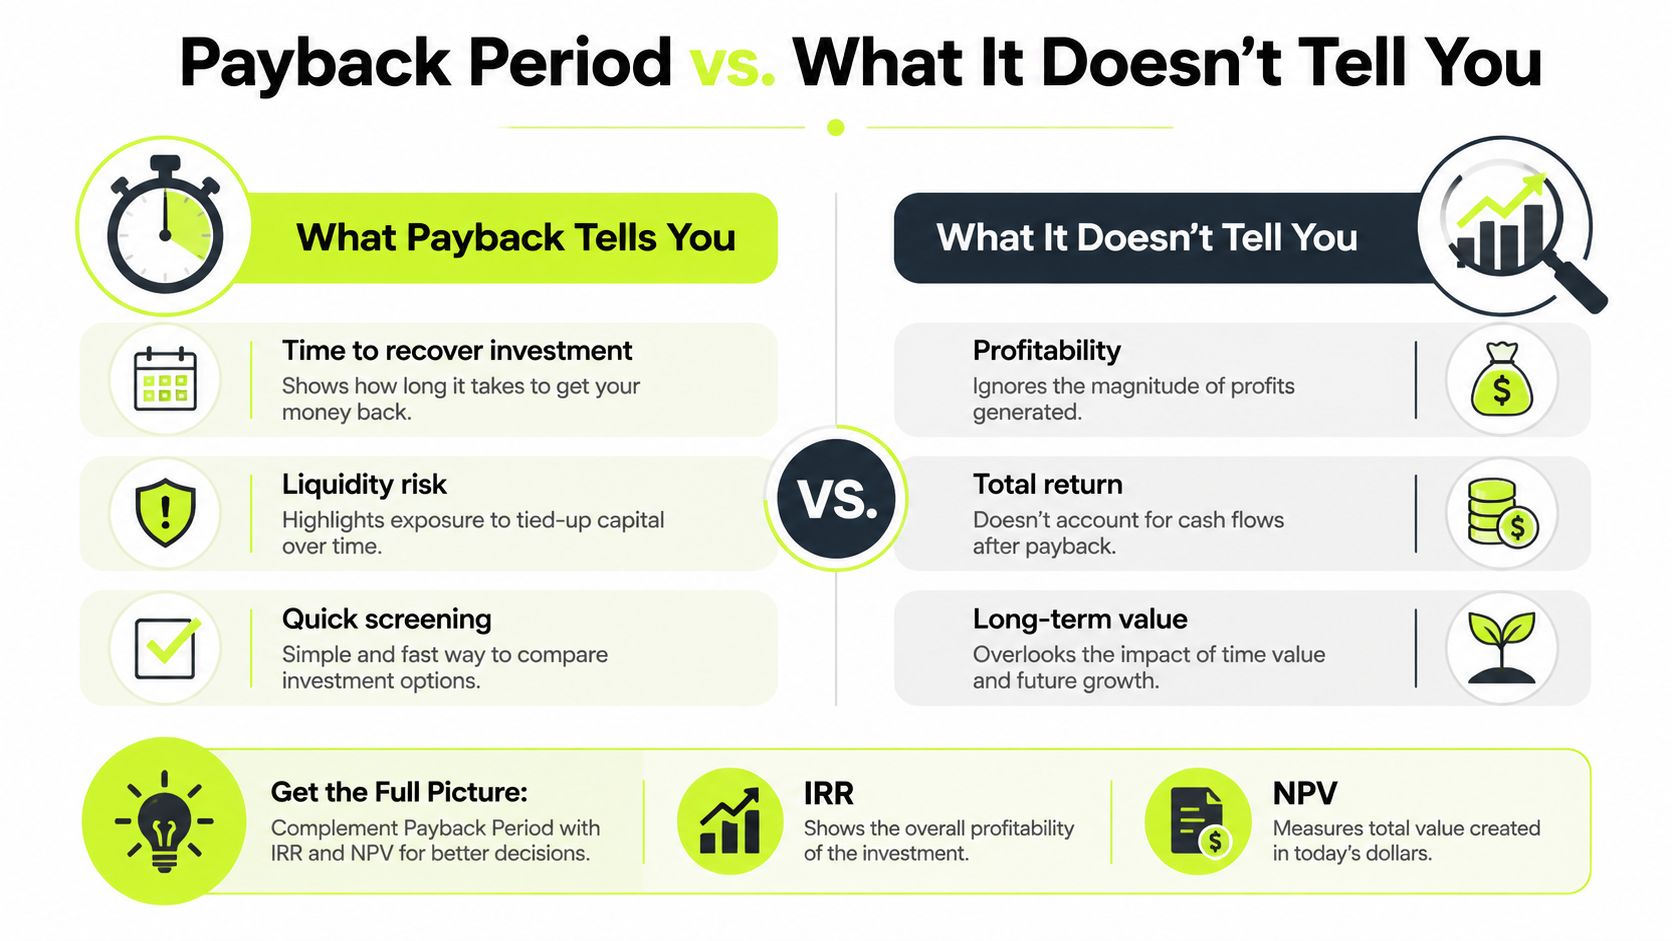
Payback period tells you when you recover the initial outlay. It does not tell you whether the project creates the most value over time. It also ignores cash flows after breakeven, which means a project with strong tail-end returns can look weaker than it really is.
That's why I treat it as a screening metric, not a final answer. IRR and NPV still have a place. They answer different questions, and if you collapse them into one number, you lose useful decision texture.
A short payback can hide a mediocre business case. A long payback can hide a strong one.
The practical move is to use payback as the first filter, then pressure-test the survivors with NPV or IRR. That's especially true when the decision affects strategic position, customer retention, or platform value beyond the recovery point.
In practice, the number works best when you already know the decision is financially viable and you're comparing speed of recovery, not long-run upside. Used that way, it sharpens judgment. Used alone, it can mislead.
Where Payback Period Meets Accounts Receivable
Once you move from capital budgeting to collections, payback period stops being a theory term and becomes a day-to-day operating issue. In receivables, the same logic applies, cash is out the door when the work is delivered, and it comes back only when the invoice clears.
That's why Days Sales Outstanding feels like the daily version of payback. Every extra day of DSO extends the time before the business gets back to whole. For firms that invoice clients after the work is done, the payback clock starts long before the payment lands.
The working-capital view
A simple way to see it is through revenue and DSO. If a firm runs $20M in annual revenue and holds a 55-day DSO, it has effectively got roughly $3M tied up in working capital, based on revenue spread across the collection window. That's not a theoretical line item. It's cash that can't pay payroll, fund hiring, or reduce reliance on other capital.
What is AR automation becomes relevant here because it shortens the distance between work delivered and cash received. The same discipline that asks “How long until the investment pays back?” also asks “How long until these invoices do?”
The useful mental model is simple. If payback period measures recovery in years, DSO measures it in days. Both are about cash exposure, just on different clocks.
Why finance teams should care
For professional services firms, overdue invoices aren't just an AR issue. They're an operating constraint. The longer receivables sit open, the more pressure lands on forecasting, hiring, and vendor payments.
That's why collections and capital decisions belong in the same room. If one investment improves client delivery but leaves cash trapped longer, it may not help the business as much as the spreadsheet suggests. Payback thinking forces that trade-off into the open.
Shortening Payback Through AR Automation
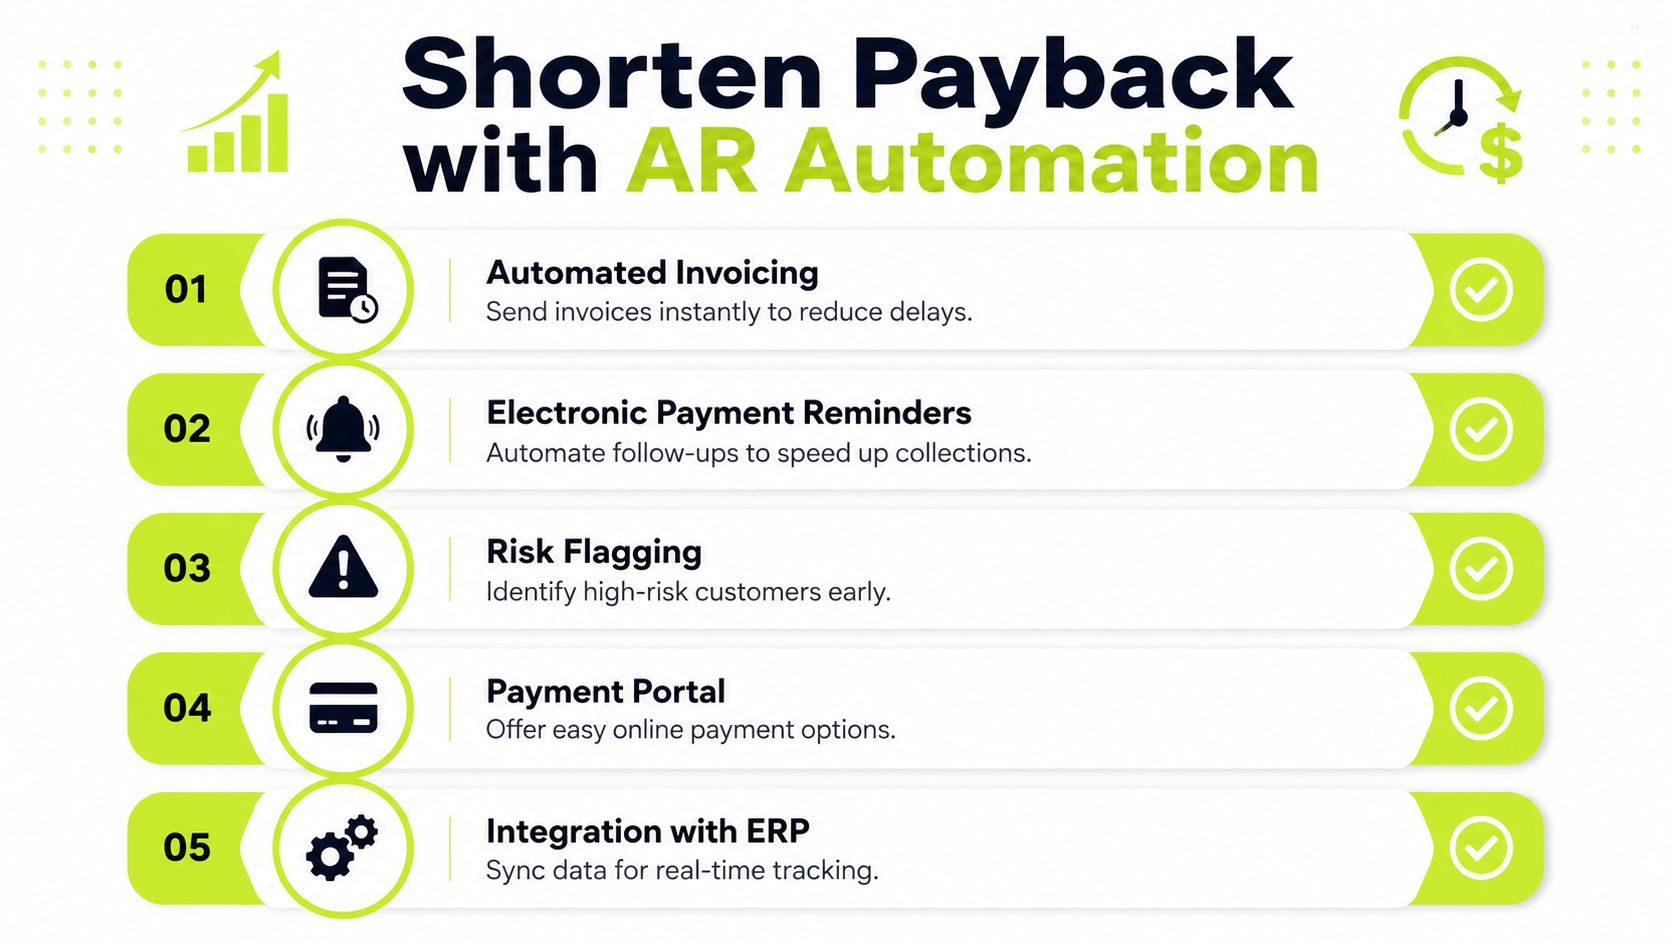
AR automation shortens the cash-conversion cycle by removing delay at each handoff. In practice, invoices go out on time, reminders follow a consistent cadence, and cash is applied without a long reconciliation queue.
The chain matters. Automated invoicing cuts send-day slippage. Dynamic reminders change tone and timing based on customer behavior. Automated cash application clears the posting lag that often leaves finance teams waiting on manual matching.
What to look for in a tool
A practical evaluation checklist stays simple.
- Invoice timing: Can the system issue invoices without waiting on a manual batch?
- Follow-up cadence: Can reminders adapt to invoice age and customer history?
- Cash application: Does payment matching happen automatically or only after review?
- Risk flagging: Can the team spot invoices that need attention before they go stale?
- Workflow fit: Does it connect cleanly with the systems the team already uses?
Those mechanics matter more than feature lists. If the tool does not shorten the time between billing and collection, it does not improve payback in any meaningful way.
For teams comparing process options, how to automate accounts receivable gives a useful framing, and invoice automation explained separates invoice workflow from collections execution.
Where Resolut fits
Resolut is one option in this category, an AI-driven AR system that handles billing, outreach, risk identification, and cash application in one workflow. For a firm trying to reduce DSO, the question is whether the receivables cycle gets shorter and less manual.
The decision point is straightforward. If overdue invoices are creating working-capital pressure, AR automation deserves a hard look. If the team is already moving cash quickly and consistently, the ROI case is less urgent.
Putting It All Together as a Finance Operator
Payback period is a timing tool with a liquidity bias. That's why it belongs in the same working set as DSO, IRR, and NPV, not as a replacement for them. It gives you a fast read on how long cash is exposed before breakeven, which is often exactly what a CFO needs in a capital-constrained firm.
The formula set stays simple. Initial Investment ÷ Annual Cash Flow for even cash flows. Years before break-even + (unrecovered amount ÷ cash flow in the recovery year) for uneven timing. Discounted payback when time value of money should be inside the decision.
The common mistake is treating payback as a profitability score. It isn't. It tells you about recovery speed and liquidity risk, then leaves value creation to other tools.
For teams that want a deeper operational lens, finance document automation insights can help connect workflow control to the cash cycle. That connection matters because the faster the billing and collections process runs, the shorter the practical payback on your receivables work becomes.
Resolut automates AR for professional services with consistent, accurate, and human execution.
If you're trying to shorten the time between delivery and cash, look at your receivables process with the same discipline you'd apply to any investment. Visit Resolut to see how AR automation can help your team reduce DSO and tighten cash recovery without adding more manual work.