
What Is AR Turnover Ratio? Boost Cash Flow In 2026
Understand what is ar turnover ratio, how to calculate it, and its effect on cash flow. This 2026 guide helps professional services firms reduce DSO.
Revenue can look healthy while cash feels tight.
A professional services firm closes work, sends invoices on time, and sees solid top-line performance. Then payroll week arrives, partner draws are due, and the bank balance says something very different. The problem usually isn’t whether the firm is profitable. It’s whether billed revenue is converting into cash with enough speed and consistency to support the business.
That gap creates operational drag. Controllers spend too much time chasing status updates. Owners get pulled into collections calls they shouldn’t have to make. Client service leaders keep promising “payment is in process,” while finance tries to forecast with incomplete information.
In firms between $3M and $50M, this gets amplified by project-based billing, milestone invoices, exceptions, and client approval chains. One delayed invoice doesn’t just sit in aging. It distorts hiring plans, pushes out vendor payments, and makes every forecast less reliable.
That’s where what is ar turnover ratio stops being an accounting definition and becomes a control metric.
It tells you how often your receivables convert to cash over a period, and it helps you answer operator-level questions: Are we collecting in line with our terms? Is AR growing faster than sales? Are slow payments a client issue, a process issue, or a policy issue?
A lot of finance teams watch revenue closely and review AR aging regularly. Fewer use AR turnover ratio as a management lever. They should. It gives you a cleaner line of sight between invoicing activity and cash in the bank.
Introduction The Gap Between Billed Revenue and Banked Cash
A familiar pattern shows up in professional services firms. The P&L says the month was strong. Utilization is good. Billings are up. But cash receipts lag, and finance is left explaining why a profitable firm still feels constrained.
That’s usually when teams start focusing on symptoms instead of the system. They chase old invoices one by one. They escalate the loudest accounts. They push for faster collections without knowing whether the underlying issue is billing quality, client payment friction, or loose terms.
What finance leaders are actually dealing with
In a services business, AR is rarely just an accounting balance. It reflects how the firm sells, scopes, invoices, follows up, and resolves disputes.
A delayed payment can come from several places:
- Unclear invoices: Clients hold payment because hours, milestones, or expenses don’t match what they expected.
- Weak follow-up cadence: The invoice goes out, then nothing happens until it’s already overdue.
- Approval bottlenecks: The buyer is willing to pay, but legal, procurement, or project sponsors haven’t approved internally.
- Terms drift: Sales promises one thing, finance enforces another, and the client pays on its own timeline.
When this becomes normal, forecasting gets softer than it should be. You can still run the business that way. You just can’t run it with much confidence.
Strong revenue doesn’t protect cash flow if collections are slow. Receivables have to turn.
Why AR turnover matters more than most firms realize
The AR turnover ratio gives you a compact measure of collection efficiency. It helps you see whether receivables are moving through the system or accumulating faster than they’re being cleared.
For CFOs and controllers, that matters because it sharpens decisions around hiring, draws, debt, and growth. If the ratio weakens, the business may be extending more credit than it realizes. If it improves, finance gains room to operate without leaning as hard on short-term cash management.
This is also why firms evaluating accounts receivable automation, AI AR automation, or AR software for professional services shouldn’t frame the problem as “how do we send more reminders.” The better question is simpler. How do we create a collection process that’s predictable, measurable, and aligned with client relationships?
What is AR Turnover Ratio The Core Concept Explained
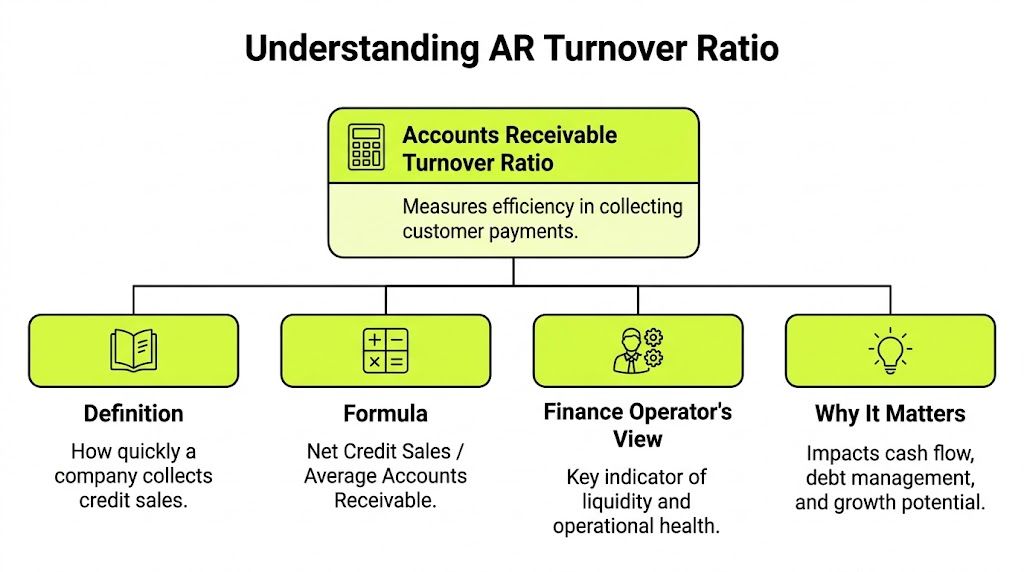
The accounts receivable turnover ratio measures how many times a business collects its average receivables during a period.
In plain terms, it shows how efficiently your firm converts credit sales into cash. If your firm invoices clients and waits to get paid later, this ratio tells you how fast that cycle is moving.
Formula AR Turnover Ratio = Net Credit Sales / Average Accounts Receivable
What goes into the formula
Two inputs matter.
First is net credit sales. This is not total revenue. It’s credit sales only, reduced for returns and allowances. In a professional services firm, that usually means invoiced work that created a receivable, not retainers already collected in cash or any sales activity that never hit AR.
Second is average accounts receivable. That’s typically the beginning AR balance plus the ending AR balance, divided by two. Using an average matters because a single point-in-time balance can be misleading, especially if a large client payment landed right before month-end.
What “turns” really means
Finance teams often talk about “turns” because it’s a useful shorthand. If your ratio is higher, your receivables are turning into cash more frequently. If it’s lower, cash is staying trapped in AR longer.
Think of it as how often the firm reloads liquidity from work already delivered.
A ratio of 10.4 means the company collects its average receivables 10.4 times annually, or about every 36.5 days, based on the example provided by HighRadius on receivables turnover ratio calculation and industry average. That’s the kind of rhythm finance wants. Billed work becomes usable cash on a repeatable schedule.
Why operators care about this metric
This ratio isn’t just for external reporting. It’s an operating signal.
A controller can use it to spot whether AR is growing faster than billings. A CFO can use it to test whether collection performance is improving after process changes. A firm owner can use it to judge whether “we’re busy” is translating into “we’re liquid.”
If you want another concise explainer that frames Accounts Receivable Turnover in practical terms, that resource is worth a quick read.
The ratio is simple. The discipline behind it isn’t. Clean billing data, consistent terms, and timely follow-up determine whether the number means control or just activity.
Calculating Your AR Turnover Ratio Step-by-Step
You don’t need a complex model to calculate AR turnover. You need the right inputs and a consistent method.
For a professional services firm, I prefer keeping the calculation tight and repeatable. Pull the numbers from the same period each time. Don’t mix annual sales with monthly AR balances. Don’t include cash receipts that never created receivables.
Step 1 Find net credit sales
Start with revenue that was billed on credit.
That means excluding cash sales and adjusting for returns or allowances. For most services firms, this is the invoiced amount that created AR after any credits or write-downs tied to billing corrections.
If your billing data is messy, fix that first. A bad numerator gives you a clean-looking but useless ratio.
Step 2 Find beginning and ending AR
Use the accounts receivable balance at the start of the period and the balance at the end.
Those figures usually come straight from your balance sheet or AR subledger. If your firm has seasonality or large project billing swings, many finance teams also calculate this monthly for better visibility.
Step 3 Calculate average AR
The standard approach is simple:
- Beginning AR plus ending AR
- Divide by two
If you want a deeper walkthrough on this input, this guide on how to calculate average accounts receivable is useful.
Step 4 Divide net credit sales by average AR
That final division gives you the ratio.
A few examples make the mechanics clearer. In a real-world example, Flo’s Flower Shop had $100,000 in gross credit sales, $10,000 in returns and allowances, and $90,000 in net credit sales. With average AR of $12,500 from ($10,000 + $15,000) / 2, the result was 7.2 times yearly, as shown in NetSuite’s walkthrough of the accounts receivable turnover ratio.
MyAccountingCourse’s Bill’s business example is even more useful as a warning sign. $50,000 in net credit sales over $15,000 average AR produced 3.33 turns, which means collections every 110 days. That’s slow enough to put real pressure on cash.
A services firm example without forcing fake precision
For a hypothetical $10M professional services firm, the same process applies. Pull net credit sales for the year. Pull beginning and ending AR. Average the AR balances. Divide.
What matters isn’t the spreadsheet complexity. It’s consistency.
Operator rule: Calculate the ratio the same way every month or quarter. Trend quality matters more than a one-time annual number.
If your team is adopting QuickBooks AR automation or another billing system, lock the calculation logic early. Otherwise, every discussion about improving collections turns into an argument about definitions.
Interpreting the Ratio What High and Low Values Reveal
Once you have the number, the next question is the one that matters. Is it telling you the firm is in control, or is it exposing friction you’ve normalized?
A single ratio won’t diagnose every AR problem. But it does tell you where to look.
What a lower ratio usually signals
A lower AR turnover ratio means receivables are taking longer to convert into cash.
In a professional services setting, that often points to one of four conditions:
- Collections are inconsistent: Follow-up depends on who remembers, not on a defined cadence.
- Billing quality is weak: Time entries, scope references, or approvals are incomplete, so invoices stall.
- Terms are too loose: The firm accepts payment behavior that doesn’t support its cash needs.
- Client risk is rising: Some customers may be using your firm as a source of working capital.
None of those fixes itself. If the ratio is trending down, finance should assume the issue is structural until proven otherwise.
What a higher ratio usually means
A higher ratio generally indicates stronger collection discipline and better liquidity.
That’s good. It usually means invoices go out cleanly, clients understand what they owe, and payment happens close to terms. In a healthy services firm, a strong ratio often reflects alignment between operations, billing, and collections.
But simplistic advice falters. “Higher is better” is true only up to a point.

When a high ratio becomes a warning sign
An excessively high ratio can mean the firm is collecting fast because it has become too rigid.
The risk is real. An underserved angle in AR turnover analysis is that very high ratios, such as above 15-20 in retail or tech services, can signal overly restrictive credit policies that suppress growth. In the same discussion, recent 2025 survey data cited there notes that 28% of mid-market B2B firms with AR turnover above 12 reported 10% YoY customer churn due to payment friction, as referenced qualitatively in the earlier discussion of this topic.
For professional services firms, the issue usually isn’t a retail-style ratio. It’s behavior. Requiring every client to prepay, refusing any milestone flexibility, or escalating too aggressively can protect cash while damaging expansion revenue and client trust.
Fast collection is healthy. Payment friction that pushes good clients away is not.
What to look at alongside the number
Interpretation improves when you pair the ratio with operational context.
Use a short review set:
Signal | What it may indicate |
|---|---|
Ratio falling while sales rise | AR is building faster than collections |
Ratio stable but disputes rising | Billing quality issue, not necessarily follow-up |
Ratio rising with client complaints | Terms may be too aggressive |
Ratio weak in a few accounts only | Concentration risk, not a whole-system failure |
This is why finance leaders should read the ratio as a story, not a score. It tells you whether cash conversion is improving, but the root cause sits in policy, process, or customer mix.
AR Turnover Ratio vs DSO The Critical Link to Cash Flow
AR turnover ratio tells you how often receivables are collected. DSO, or Days Sales Outstanding, tells you how long that collection takes in days.
Most executives find DSO easier to feel. A ratio is abstract. Days are not.
The math behind the relationship
The relationship is direct and inverse:
DSO = 365 / AR Turnover
That means when turnover improves, DSO falls. When turnover weakens, DSO rises.
A documented example makes this concrete. An AR Turnover of 12.55 translates to a DSO of about 29 days, using the formula 365 / 12.55 ≈ 29, according to Allianz Trade’s explanation of the accounts receivable turnover ratio.
Why this matters operationally
In a services firm, every extra day in DSO means cash remains tied up in work already delivered.
That affects more than treasury. It changes how much flexibility you have for payroll, partner distributions, contractor payments, hiring, and tax planning. A firm with strong utilization but weak DSO can still feel cash-poor because the business is financing clients longer than intended.
If your team wants a broader primer on the metric itself, this explanation of what is DSO is a helpful companion.
What a drop in turnover does to cash control
The ratio becomes especially useful when it moves below sector norms.
Allianz Trade notes that a drop from 10 to 6 can drive 20-30% increases in DSO when the cause is lenient terms or weak collections. That same shift can also inflate bad debt provisions. For a CFO, this is the important point. A declining turnover ratio isn’t just an AR issue. It’s an early warning on working capital quality.
How to use both metrics together
I’d use them differently inside the same firm:
- AR turnover ratio for trend analysis and management review
- DSO for communication with partners and operating leaders
- Aging detail for account-level action
That combination works because each metric answers a different question.
Metric | Best use |
|---|---|
AR turnover ratio | Overall collection efficiency |
DSO | Speed of cash conversion in days |
Aging report | Which invoices require action now |
If you want control, don’t choose between turnover and DSO. Use turnover to detect drift and DSO to show the business what that drift costs in time.
This is also where reduce DSO stops being a slogan. It becomes a measurable output of stronger billing discipline, cleaner workflows, and better collection timing.
Industry Benchmarks How Your Firm Measures Up
A ratio without context can mislead.
A law firm, agency, engineering consultancy, and manufacturer don’t bill the same way, and they shouldn’t expect identical turnover. Client behavior, project structure, approval cycles, and invoice complexity all shape collection speed.
Benchmark ranges worth using
Sector data is useful because it keeps teams from comparing themselves to the wrong peer set.
According to RiskConcern’s analysis of receivables turnover ratio by sector and industry in the U.S., retail runs around 8-10 turns, manufacturing around 6-8, and professional services around 9-11. The same source notes that 7.8 is a good cross-industry average, while top-performing B2B service firms can exceed 11 turns.
For a professional services firm, that 9-11 range is the most relevant reference point.
AR Turnover Ratio Benchmarks by Industry 2026
Industry | Average AR Turnover Ratio | Approximate DSO (Days) |
|---|---|---|
Retail | ~8-10 | ~36.5-45.6 |
Manufacturing | ~6-8 | ~45.6-60.8 |
Professional services | ~9-11 | ~33.2-40.6 |
Why services firms sit where they do
Professional services usually perform better than slower-turn sectors because billing is tied to delivered labor, retainers, or project milestones. But they rarely behave like retail because payments still move through client approval chains.
That creates a practical target range. If your firm is below the professional-services band, review collections process and invoice quality first. If you’re inside it, focus on consistency across client segments. If you’re above it by a lot, check whether your terms are creating unnecessary friction.
A better benchmarking mindset
Use benchmarks as guardrails, not as a substitute for judgment.
A strong services firm can still have a weak quarter if a few large clients delay payment. A firm can also post a strong turnover ratio while hiding churn caused by a harsh payment experience.
That’s why I’d benchmark in three layers:
- Against your sector: Start with the professional services range.
- Against your own history: Trend line matters more than one month.
- Against your client mix: Enterprise clients, public sector buyers, and midsize commercial accounts behave differently.
Benchmarks help you set ambition. They don’t remove the need to understand why your number is where it is.
Actionable Strategies to Improve Your AR Turnover
Improving AR turnover usually has less to do with “collections effort” and more to do with operating discipline.
In professional services firms, weak AR performance often starts before the invoice is sent. It starts in pricing, engagement terms, billing design, and ownership. If those pieces are loose, no reminder sequence will fix the root problem.

Policy needs to support cash, not just sales
Start with terms.
If every exception gets approved, your published payment terms don’t mean much. Finance should know which clients receive custom terms, why they received them, and whether those terms still make sense. Services firms often inherit payment habits deal by deal, then discover later that collections have become negotiable.
A few policy controls work well:
- Define default terms clearly: Sales, delivery, and finance should all be working from the same standard.
- Tie billing to milestones: Don’t let invoicing wait until the end of a long project if value is being delivered in stages.
- Set escalation thresholds: Decide in advance when finance steps in, when account leadership gets involved, and when work may need to pause.
- Review credits carefully: Frequent invoice adjustments often signal upstream scoping or approval issues.
The goal isn’t strictness for its own sake. It’s consistency.
Process is where most AR leakage happens
This is the part firms underestimate.
A sound collection process starts with invoice accuracy, but it also depends on timing, communication, dispute handling, and ownership. If no one owns follow-up until invoices are well past due, your process is training clients to pay late.
Teams that want a practical outside perspective on understanding your collection process may find that framework useful, especially when mapping who owns each step from invoice delivery through resolution.
What usually works:
- Send invoices clean and complete: Include the right contacts, backup, PO references, and project identifiers the first time.
- Follow up before invoices age badly: Polite confirmation soon after send date is often more effective than a late escalation.
- Separate disputes from delinquency: If a client has a valid billing question, route it quickly. Don’t leave it sitting in a collector’s queue.
- Track promises to pay: Verbal updates without dated commitments don’t improve forecast accuracy.
What usually doesn’t work:
- One-off heroics: A partner calls the client only when cash is already tight.
- Generic reminder blasts: Clients ignore vague notices that don’t reference the actual issue.
- Delayed internal coordination: Finance knows the invoice is stuck, but project leadership hears about it too late.
Collection performance usually reflects process quality upstream. If invoices are confusing, approvals are missing, or disputes linger, AR turnover falls for predictable reasons.
Automation changes the economics of follow-up
Manual AR can work when volume is low and account complexity is simple. Most growing firms don’t stay in that condition for long.
As invoice counts rise, manual follow-up becomes uneven. Some clients get contacted too often. Others get missed. Notes live in inboxes. Promises to pay don’t make it into the forecast. Accounts receivable automation then starts to matter.
There’s strong evidence that automation affects outcomes. Amid 2025-2026 economic headwinds, AI-driven platforms can boost turnover by 20-30%, and J.P. Morgan’s Q1 2026 treasury report shows automated AR firms achieving 9.5 average turns versus 6.2 for manual processes in major markets, as noted in J.P. Morgan’s analysis of AR turnover and DSO. The same source also cites Paystand benchmarks showing autopilot collections increasing recoveries by 25% and reducing DSO from 45 to 32 days for tech and services firms.
That doesn’t mean software solves bad policy. It means good policy and good process become scalable.
A useful primer on how to automate accounts receivable can help teams think through where automation should sit across reminders, payment capture, cash application, and visibility.
Here’s a quick visual overview of the shift from manual effort to structured execution:
Where AI AR automation helps in practice
For professional services firms, the biggest gains usually come from consistency and segmentation.
Instead of treating every invoice the same way, AI AR automation can support workflows based on client behavior, invoice age, dispute status, and risk profile. That matters because a late-paying but strategic client shouldn’t receive the same message cadence as a straightforward account that needs a reminder.
The practical wins often look like this:
Improvement area | Manual approach | Automated approach |
|---|---|---|
Reminder timing | Staff-dependent | Scheduled and consistent |
Client segmentation | Usually limited | Rule-based and behavior-aware |
Payment visibility | Spread across email and spreadsheets | Centralized |
Forecast confidence | Subjective | More structured |
Cash application follow-through | Often delayed | Faster and more standardized |
QuickBooks AR automation and system fit
A lot of firms in this size range are still anchored in QuickBooks for core accounting. That’s fine. The issue isn’t the ledger. The issue is whether collections execution still lives in inboxes and memory.
QuickBooks AR automation becomes useful when it extends the system you already trust. The right setup should improve reminder cadence, visibility into open invoices, and reconciliation discipline without forcing finance to rebuild its accounting stack.
If I were advising a controller, I’d focus on three decisions:
- Standardize billing inputs first. Automation amplifies whatever you feed it.
- Define collection rules by client type. One policy for every account usually performs poorly.
- Measure before and after. If turnover doesn’t improve and DSO doesn’t tighten, revisit the process design, not just the tool.
The firms that improve AR turnover most reliably don’t chase harder. They remove friction, enforce consistency, and let automation handle the repetitive parts.
Conclusion From Metric to Mandate Mastering Your Cash Conversion Cycle
AR turnover ratio is one of the clearest ways to see whether your firm’s revenue is becoming cash with enough speed and discipline.
The formula is straightforward. The value comes from what you do with it. Calculate it consistently. Interpret it with context. Compare it to the right benchmarks. Then use it to tighten policy, improve billing quality, and bring consistency to collections.
For professional services firms, this metric is especially useful because it exposes the gap between delivered work and collected cash. That gap affects forecasting, hiring, owner distributions, and day-to-day confidence in the numbers.
It also helps finance avoid two common mistakes. One is tolerating weak collection performance because revenue is growing. The other is pushing so hard on payment speed that client experience starts to erode. Strong operators manage both sides. They protect liquidity without creating unnecessary friction.
If your team is working to reduce DSO, improve cash flow, or evaluate AR software for professional services, AR turnover ratio is a solid place to start. It gives you a practical measure of whether the system is working.
Use it as a management metric, not just a reporting metric. That shift changes the conversation from “who owes us money” to “how reliably does this business convert work into cash.”
Resolut helps professional services firms bring more structure to receivables without making collections feel mechanical. If you’re looking for a calmer way to improve follow-up consistency, visibility, and payment predictability, Resolut is worth a look. Resolut automates AR for professional services, consistent, accurate, and human.