Cash From Operations Ratio: A CFO's Guide to Solvency
A guide for CFOs on the cash from operations ratio. Learn the formula, calculate it from a cash flow statement, and improve it with AR automation.
Your P&L says the firm had a strong quarter. Collections says several large invoices are still open. Payroll, partner draws, and tax payments are coming due anyway.
That gap is where a lot of professional services firms get into trouble.
Accrual profit can look healthy while operating cash is thin. Revenue gets recognized before cash shows up. Retainers get consumed. Change orders get debated. A few slow-paying clients can turn a profitable month into a liquidity problem very quickly. If you want a cleaner read on whether the business can fund itself, the cash from operations ratio is one of the first numbers to pull.
The Solvency Gap Profits vs Cash Flow
Most firm owners first feel this issue operationally, not analytically. The business is growing, utilization is good, and the income statement looks respectable. But the bank balance never seems to match the reported profit.
That happens because profit answers an accounting question. Cash answers an operating one. A professional services firm can book revenue, show margin, and still struggle to meet short-term obligations if receivables keep stretching or billing discipline slips. If you need a quick refresher on how cash moves through the business, this overview of net cash flows is a useful starting point.
Where the disconnect usually starts
In practice, the solvency gap usually comes from a handful of repeat problems:
- Revenue arrives before cash: Work is completed, invoices go out, and the income statement improves before payment hits the bank.
- AR gets operationally neglected: Follow-up is inconsistent, disputed invoices sit too long, and no one owns collections tightly enough.
- Short-term obligations don't wait: Payroll, rent, tax payments, software renewals, and vendor bills come due on schedule whether clients pay or not.
A business can tolerate this for a while. It can't build on it safely.
Profit tells you whether the work was priced and delivered well. Cash tells you whether the business can stay in control.
Why this ratio matters to operators
The cash from operations ratio gets to the core question quickly. Can the business generate enough cash from normal operations to cover what it owes in the near term?
That's why I treat it as a solvency metric first, not just another finance KPI. It tells a CFO, controller, or owner whether the company is self-funding operations or leaning on timing, credit, or deferred pain. When this ratio weakens, the fix usually isn't theoretical. It sits in billing accuracy, collection cadence, payment friction, and client discipline.
For professional services firms, that makes the ratio useful because it connects directly to things you can improve.
What the Cash From Operations Ratio Really Measures
The cash from operations ratio measures how much operating cash your business generates relative to its current liabilities. In plain terms, it asks whether your core business is producing enough real cash to cover near-term obligations without depending on new borrowing or asset sales.
That distinction matters. A firm can have a respectable current ratio and still be tight on cash if receivables are slow and earnings are tied up in uncollected invoices.
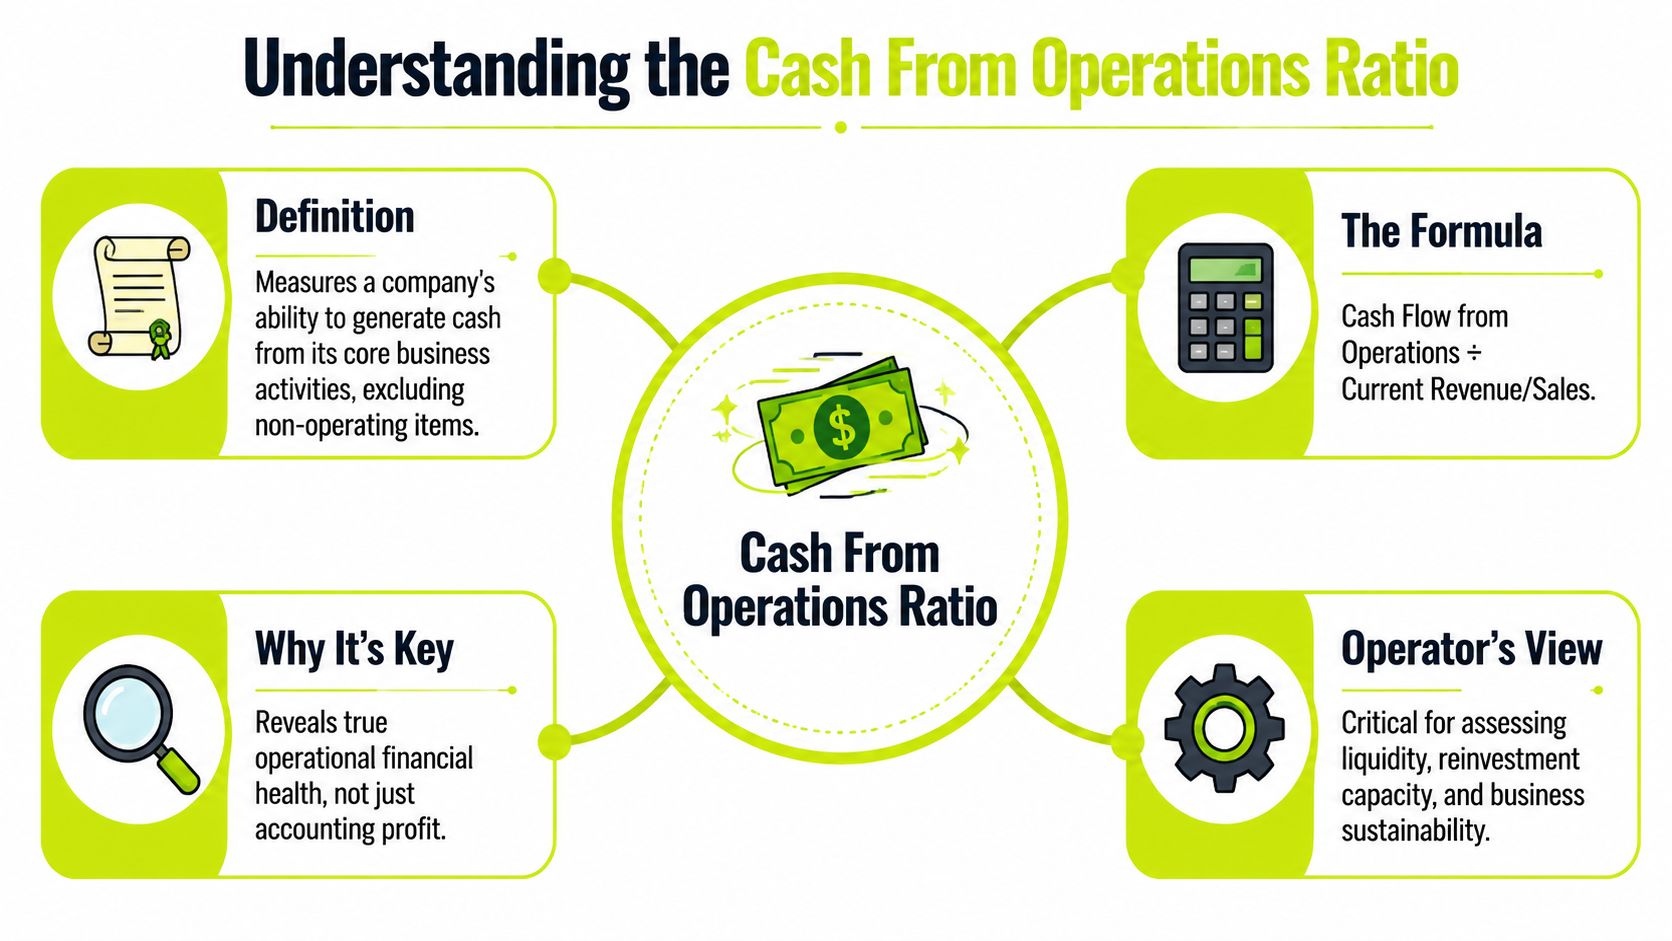
Core formula: Cash Flow from Operations ÷ Current Liabilities A result above 1.0 indicates operations are generating enough cash to cover short-term obligations. A result below 1.0 points to liquidity pressure.
What goes into the numerator
The numerator is cash flow from operations, often shown on the cash flow statement as net cash provided by operating activities.
Under the indirect method, it's built from net income, then adjusted for non-cash items and working capital movements. As Wall Street Prep's explanation of the operating cash flow ratio notes, the ratio is technically derived from the cash flow statement as Net Income + Non-Cash Expenses ± Changes in Working Capital. Their example uses $135mm of cash flow from operations and $55mm of current liabilities to produce 2.5x coverage, meaning the core business generates $2.50 in cash for every $1 of short-term obligations.
For a services firm, the most important working capital adjustment is often accounts receivable. If AR grows faster than collections, operating cash weakens even when reported earnings look fine.
What belongs in the denominator
The denominator is current liabilities from the balance sheet. That usually includes accounts payable, accrued expenses, payroll liabilities, taxes payable, deferred revenue due within a year, and the current portion of debt or lease obligations.
The ratio provides more utility than a generic liquidity glance. It compares obligations due soon with cash generated by operations, not with assets that may or may not convert to cash on time.
Why operators trust this more than simpler ratios
The current ratio can overstate comfort because it includes receivables and other current assets at book value. The cash from operations ratio is harder to flatter.
A healthy ratio doesn't mean you're efficient. It means your operations are generating enough cash to support the promises already sitting on your balance sheet.
That makes it a better operating reality check for firms that invoice after milestones, rely on a small number of large clients, or experience uneven collection cycles.
How to Calculate the Cash From Operations Ratio
You don't need a complex model to calculate the cash from operations ratio. You need two numbers from your financial statements, and they should already exist in QuickBooks or your reporting package.

Pull the two inputs
Use this sequence:
- Find cash flow from operations: On the statement of cash flows, pull net cash provided by operating activities.
- Find current liabilities: On the balance sheet, pull total current liabilities.
- Divide the first by the second: That result is your cash from operations ratio.
If your monthly close is messy or bank activity needs cleanup before reporting, it can help to extract bank statement data using OkraPDF so finance can reconcile cash movements faster before finalizing the cash flow statement.
A simple professional services example
Assume a firm generates about $10M in annual revenue. The controller closes the month and finds:
Financial statement line | Amount |
|---|---|
Net income | qualitative starting point |
Non-cash expenses | qualitative adjustment |
Working capital changes | qualitative adjustment |
Net cash provided by operating activities | $1,200,000 |
Total current liabilities | $1,000,000 |
Now divide:
$1,200,000 ÷ $1,000,000 = 1.2
That means the firm generated $1.20 of operating cash for every $1.00 of current liabilities.
This is a workable result. It isn't a reason to relax. If the firm has uneven client concentration or upcoming tax payments, I would still want to know whether collections are stable or if one large invoice is doing too much of the work.
Where finance teams get this wrong
The common errors aren't mathematical. They're classification and timing mistakes.
- Using EBITDA instead of operating cash flow: EBITDA ignores working capital, which is exactly where AR problems show up.
- Using ending AP only instead of total current liabilities: That understates what the business owes in the near term.
- Calculating once a year: For a services firm, this ratio is more useful monthly or quarterly because billing and collections can shift quickly.
A short walkthrough can help if your team wants to align the statement mechanics with the ratio:
Operator's habit: Calculate the ratio on the same cadence you review AR aging. The number gets more useful when it sits next to collections reality.
Interpreting the Ratio and Industry Benchmarks
A ratio by itself doesn't make a decision for you. It gives you a signal. The interpretation depends on level, trend, and how your operating model turns revenue into cash.
At the highest level, the rule is simple. Above 1.0 means operations are generating enough cash to cover short-term obligations. Below 1.0 means the business may need to rely on outside financing, delayed payments, or other stopgaps to stay comfortable.
What good and bad usually look like
For professional services firms, context matters because the business is often AR-heavy. Revenue can be concentrated, billing cycles can be irregular, and project disputes can delay payment without showing up immediately in headline revenue.
The benchmark data below is useful as a decision tool, not a trophy chart. As Groww's operating cash flow ratio benchmark discussion notes, professional services firms average 1.7x in 2024 benchmarks, but AR delays can compress that to 1.2x, while AI-driven AR tools can lift it to 2.2x. The same source also notes that ratios declining by more than 20% YoY predict 30% higher bankruptcy odds.
Industry | Conservative (Healthy) | Aggressive (High-Growth/Risk) | Warning Zone |
|---|---|---|---|
Professional services | 1.7x | 1.2x | Below 1.0x |
SaaS | qualitative peer range tends to be higher | qualitative high-growth tolerance | Below 1.0x |
Manufacturing | qualitative peer range tends to be lower | qualitative working-capital pressure | Below 1.0x |
Trend matters more than a snapshot
One quarter can mislead. A tax payment, annual bonus run, or timing issue can distort a single period.
What matters more is direction. If the ratio slips for several quarters while revenue still grows, finance should assume collections or working capital discipline is weakening until proven otherwise. That's where supporting metrics matter, especially DSO. If you need a tighter operational definition, this guide on what DSO means and how to use it pairs well with ratio analysis.
How to read the number in practice
I usually frame interpretation around three operating questions:
- Is the ratio above 1.0 consistently? If yes, the firm is at least covering short-term obligations from operations.
- Is it improving or deteriorating? A weakening trend often matters more than whether the latest month is slightly above the line.
- What is driving the movement? In services firms, the answer is often AR aging, billing disputes, client concentration, or poor follow-up discipline.
When the ratio drops, don't start with cost cuts. Start with receivables, billing accuracy, and payment friction.
That sequence matters. Many firms respond to cash pressure by freezing spend while ignoring the slower-moving problem in collections. That can preserve cash briefly, but it doesn't correct the operating leak.
A Deeper Diagnostic The OCF to Net Income Ratio
The cash from operations ratio tells you whether operations can cover short-term obligations. A different ratio tells you whether reported earnings are converting into cash cleanly.
That metric is Operating Cash Flow to Net Income. It is one of the better early warning indicators for earnings quality in an AR-heavy business.

What this ratio reveals
When OCF / Net Income stays at or above 1.0, reported profit is generally being backed by actual cash generation. When it falls below 1.0 consistently, finance should investigate quickly.
According to Upflow's cash flow analysis guidance, for AR-heavy businesses, an OCF/NI ratio consistently below 1.0 signals aggressive revenue recognition or growing receivables. The same source notes that a deteriorating OCF/NI ratio often precedes cash flow crises by 1 to 2 quarters.
For a professional services firm, that matters because the problem often appears here before it becomes obvious in headline cash stress.
What usually drives deterioration
This ratio tends to weaken for a few practical reasons:
- Receivables are expanding too fast: The firm is billing, but customers aren't paying in step with recognized revenue.
- Collections are reactive: Follow-ups happen late, inconsistently, or only when balances become uncomfortable.
- Revenue quality is slipping: Work is being recognized on paper faster than it is being validated and collected.
None of those are abstract accounting issues. They are operating issues.
If net income rises while operating cash lags, the firm hasn't turned performance into liquidity yet.
Why it matters before DSO gets ugly
DSO is useful, but it can smooth over risk when a few large invoices distort the average. The OCF to net income ratio captures a broader earnings-quality problem. It tells you whether the business is building profit on cash conversion or on timing.
That's why I like to review it beside the standard cash from operations ratio. One tells you where solvency stands now. The other often hints at where pressure is forming next.
How to Improve Your Cash From Operations Ratio
If the ratio is weak, the fastest operational lever is usually not pricing, not hiring restraint, and not a new credit facility. It's accounts receivable discipline.
For professional services firms, the path to a stronger cash from operations ratio is usually straightforward. Bill accurately, invoice promptly, follow up consistently, reduce payment friction, and escalate risk earlier. That is where accounts receivable automation and AI AR automation become useful. Not as a finance trend, but as infrastructure for getting paid on time.
The operating changes that actually move the number
Manual AR processes fail in predictable ways. Reminders go out late. Different collectors use different language. Partners hesitate to press clients. Payment links are buried or missing. Reconciliation takes too long, so no one trusts the aging report fully.
The better approach is disciplined and systematic:
- Automate reminder cadence: Every invoice gets the right follow-up sequence before and after due date.
- Remove payment friction: Give clients a simple path to pay without email back-and-forth.
- Flag risk early: Use workflow rules or AI to identify invoices likely to slip before they become old news.
- Tighten cash application: If payments aren't matched quickly, the ledger stops being a useful collections tool.
- Connect AR to your accounting stack: Good AR software for professional services should work cleanly with systems already in place, including QuickBooks AR automation workflows where relevant.
What tends to work and what doesn't
What works is consistency. Firms improve cash flow when collections become an operating process instead of a heroic effort at month-end.
What doesn't work is sending one overdue email, waiting two weeks, then asking a partner to step in. That pattern trains clients to pay on their own schedule.
As noted in this cash flow margin and collections analysis, during the 2020 downturn, AR optimizations boosted cash recoveries by 12% to 18% for firms adopting automation. The same source says a 2025 PwC study linked high cash flow margins to a 2x faster DSO reduction, from 45 days to 22 days, via tools that address unpaid invoices.
If your working capital needs attention beyond receivables alone, this practical guide on improving working capital is worth keeping in the finance toolkit.
The real objective
The goal isn't to create more aggressive collections for the sake of it. The goal is control.
A stronger cash from operations ratio gives the firm more room to make decisions calmly. You can pay obligations from operations, not from timing luck. You can invest with more confidence. You can reduce DSO, improve cash flow, and keep client communication professional instead of reactive.
Resolut automates AR for professional services. It helps firms run collections with consistency, accuracy, and the right human tone, so finance teams can reduce DSO, improve cash flow, and keep better control of solvency without turning client relationships into a mess.