Free Credit Risk Analysis Excel Template for 2026
Download our credit risk analysis excel template. A step-by-step guide for CFOs to assess client risk, improve cash flow, and reduce DSO with a practical model.
A signed engagement letter can create a false sense of safety. Revenue is booked in the pipeline, delivery teams are staffed, and everyone assumes payment will sort itself out later.
That's where many professional services firms get exposed. You're not underwriting a one-time retail transaction. You're extending credit every time you start work before cash is collected. If that decision is based on instinct, a sales promise, or a quick glance at the client's website, your cash flow is carrying more risk than your P&L suggests.
A practical credit risk analysis excel template gives finance a controlled way to evaluate new and existing clients before receivables age into a collections problem. It won't replace judgment. It will make judgment visible, consistent, and easier to defend.
A Disciplined Approach to Client Credit Risk
The common scenario is straightforward. Sales lands a large new client. The scope is attractive, the logo looks credible, and the team wants to start immediately. Finance is left asking the harder question. Will they pay on time, and what happens if they don't?
In a professional services firm, that question matters more than it does in product businesses. Labor is front-loaded. Delivery begins before cash arrives. A client who pays slowly can force you to fund payroll, subcontractors, and overhead from your own balance sheet.
Why discipline matters
The need for stronger credit models stopped being theoretical a long time ago. After the 2008 financial crisis, poor credit assessments contributed to over $2 trillion in global losses, which is why stress testing became a core part of sound risk practice, including scenarios like GDP drops of 2-5% according to this CreditMetrics discussion.
That history matters because the same lesson applies at a smaller scale. Most firms won't run a bank-grade risk desk, but they still need a repeatable process for deciding:
- Who gets standard terms and who doesn't
- When to ask for a deposit before work starts
- Which accounts need tighter monitoring once invoices are live
- How much exposure is acceptable for a single client or sector
Practical rule: If a client decision can change your cash position, it deserves a documented model, not a hallway conversation.
What the spreadsheet is really doing
A solid Excel model brings order to a process that is often scattered across email threads, accounting notes, and personal memory. It combines financial statement inputs, payment behavior, and a few structured qualitative judgments into one score you can review with leadership.
That matters for two reasons.
First, it removes avoidable inconsistency. The same client shouldn't receive generous terms from one account manager and strict terms from another just because the conversation felt different.
Second, it creates a bridge into collections policy. Once the score exists, AR can work from predefined actions rather than improvising after invoices age.
A spreadsheet won't catch everything. It can't read every shift in client intent, project politics, or internal budget freeze. But it does force the firm to ask better questions early, which is the first real step in small business credit risk management.
A pragmatic starting point
The best template is not the most academic one. It's the one your team will maintain.
For most firms in the $3M to $50M range, that means a model with a clear input sheet, a manageable ratio set, a transparent scoring engine, and obvious policy outputs. If the workbook becomes too elaborate, it dies. If it's too simple, it gives false comfort.
The right middle ground is disciplined, manual, and practical. That's enough to improve control today and enough structure to support accounts receivable automation later.
Anatomy of the Credit Risk Excel Template
A useful workbook should behave like a controlled system, not a loose collection of tabs. Every sheet needs a purpose, and each one should feed the next without hidden logic.

Input sheet
At this juncture, most models either stay clean or go off the rails. The input tab should capture only source data and management overrides that you can explain later.
I separate inputs into four blocks:
- Client profile data such as legal entity, sector, contract type, payment terms, and billing cadence
- Financial statement fields pulled from audited or management accounts
- Payment behavior fields from the ERP or QuickBooks history
- Qualitative review items like concentration risk, ownership stability, or dependency on funding
The point is simple. Don't mix formulas into the raw data area. If users can type over logic, the model becomes unreliable within a month.
Ratio analysis tab
This sheet translates raw figures into working signals. A strong template uses over 15 financial ratios and can handle 5-10 years of historical data for trend detection, as shown in the PropertyMetrics credit analysis framework.
That historical view matters. A single year can look acceptable while the trend underneath is weakening. In services, I care less about one clean reporting period and more about whether liquidity, debt levels, and margin are improving, flattening, or deteriorating.
A good ratio tab usually includes:
Focus area | What it helps answer |
|---|---|
Liquidity | Can the client meet short-term obligations without strain? |
Leverage | How much debt pressure already sits on the business? |
Profitability | Is there enough earnings capacity to support payment discipline? |
Coverage | Can operating results absorb fixed financing costs? |
Trend view | Is the client moving toward stability or away from it? |
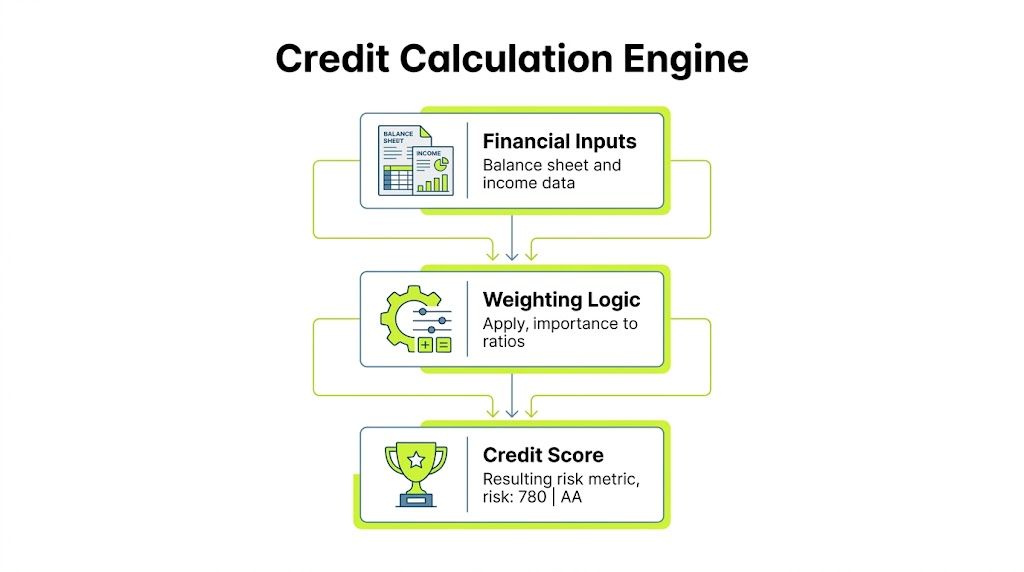
Scoring engine
This is the control center. It converts ratio results and policy judgments into one internal risk score.
Keep the logic visible. Hidden formulas and nested exceptions usually create distrust. I prefer a weighted scorecard where each factor has a clear rationale, a bounded score range, and a short comment field for overrides.
If your team can't explain why a client scored poorly in two minutes, the model is too opaque.
Risk dashboard
The dashboard isn't decoration. It should answer the questions a controller or CFO asks in a live review.
Use it to show current score, prior score, major deteriorations, key ratio flags, and the recommended credit action. Conditional formatting is useful here, but restraint matters. If every box is red, none of it is informative.
What belongs outside the workbook
Not everything should live in Excel. Store support files, financial statements, contracts, and approval memos outside the model and reference them cleanly. The workbook should remain the decision engine, not the filing cabinet.
That separation keeps the template usable and makes later migration into AR software for professional services much easier.
The Scoring Model Inputs and Formulas
A credit model is only as good as its inputs. In practice, that means the workbook has to combine accounting data, payment behavior, and a small set of management judgments without turning into a black box.
Start with the data you already trust
Most firms already have enough internal data to build a useful first version. The issue isn't lack of information. It's that the information sits in separate places.
The core inputs usually come from:
- Balance sheet fields such as current assets, current liabilities, debt, and equity
- Income statement fields including revenue, EBITDA, interest expense, and net income
- AR behavior from QuickBooks or the ERP such as average days to pay, dispute frequency, and broken promise patterns
- Commercial context like concentration in one client sponsor, project criticality, or dependence on funding rounds
If statements arrive as PDFs, it helps to use a tool that can quickly evaluate profit and loss before you map the numbers into Excel. That saves time and reduces transcription errors.
The ratios that actually matter
Not every ratio deserves equal weight. I've found it more useful to emphasize ratios that link directly to payment capacity and downside protection.
For example, Debt to EBITDA helps test whether the client is already operating under high debt burden. Interest coverage shows whether earnings can support fixed obligations. Working capital measures tell you whether short-term strain could show up in payables, including your invoices.
The modified Altman framework is a useful anchor because it gives the model a structured bankruptcy risk signal. The formula is:
Z-Score = 1.2*X1 + 1.4*X2 + 3.3*X3 + 0.6*X4 + 1.0*X5
A score above 3.0 indicates a low probability of bankruptcy, based on the methodology described in the PropertyMetrics framework. I treat that as an anchor, not a verdict. It's helpful because it introduces discipline. It's limited because it doesn't understand project delays, ownership politics, or collection friction.
A practical weighting approach
I prefer a blended score made of three layers.
- Financial strength This includes liquidity, debt utilization, profitability, and coverage ratios. It carries the most weight because it reflects the client's ability to pay.
- Payment behavior This captures what the client does, not just what the statements imply. Slow-pay patterns often surface here before they appear in annual accounts.
- Qualitative overlays This covers issues like customer concentration, sector cyclicality, and reliance on one approver. These factors matter, but they should not dominate the score unless the risk is obvious and documented.
That blend gives finance something explainable to leadership and also a stronger basis for what credit worthiness means in operating terms.
Keep the formula transparent
A score should be auditable. The workbook should show each component, its weight, the resulting subtotal, and any override.
I like to make the score logic visible in a summary panel like this:
- Financial ratio score multiplied by its assigned weight
- Payment history score multiplied by its assigned weight
- Qualitative risk score multiplied by its assigned weight
- Manual adjustment only when approved and documented
The model earns trust when users can trace a bad score back to one weak area instead of arguing with a mysterious final number.
What doesn't work
Two habits create weak models fast.
The first is overfitting. Teams add too many special-case variables because one difficult client embarrassed the model. Soon the workbook becomes impossible to maintain.
The second is pretending all inputs are equally reliable. A polished management deck should not carry the same credibility as repeated payment behavior from your own ledger.
The right scoring model is simple enough to maintain, specific enough to drive action, and strict enough to challenge optimism.
Interpreting Scores and Defining Risk Bands
A score becomes useful only when it changes what the firm does. If the workbook produces a number but AR still treats every client the same, the model is just a reporting exercise.

Turn the score into a policy
I recommend three bands because they're easy to explain and hard to misread.
Risk band | Typical interpretation | Common policy response |
|---|---|---|
Low risk | Strong capacity and stable behavior | Standard terms, standard review cycle |
Medium risk | Payable, but with visible pressure points | Deposit, milestone billing, closer monitoring |
High risk | Weak capacity, weak behavior, or both | Pay in advance, reduced exposure, senior approval |
The exact cutoffs depend on your scoring design. What matters is consistency. Sales, delivery, and finance should all know what happens when a client falls into each band.
Match terms to exposure
The model begins enhancing cash flow at this stage. A low-risk client may remain on standard Net terms. A medium-risk account might need an upfront payment before kickoff or tighter milestone invoicing. A high-risk account may need prepayment or a narrower statement of work.
Those decisions aren't punitive. They're funding decisions. Your firm is deciding how much balance-sheet risk it will carry on behalf of a client.
A credit policy works best when it changes terms before invoices age, not after collections has already inherited the problem.
Connect scoring to DSO discipline
In B2B invoicing, systematically identifying and managing risk based on credit scores has been shown to reduce DSO by 15-25 days, according to this bank credit scoring reference from Gigasheet.
That range matters because DSO is rarely fixed by one heroic collector. It improves when risk is identified early and terms, invoicing cadence, and follow-up are aligned with that risk.
A simple example:
- Low-risk client gets routine outreach and standard reminder timing
- Medium-risk client gets earlier reminder touchpoints and tighter approval checks
- High-risk client gets immediate escalation when milestones are missed
This walkthrough is useful for teams calibrating how score-based policies translate into everyday receivables work:
Remove subjectivity from collections
The hidden benefit of risk bands is internal alignment. AR no longer has to debate every exception from scratch. The spreadsheet already sets the baseline response.
That's especially important in professional services, where client relationships can make teams hesitant to push. A documented score gives finance a neutral reason to request deposits, shorten terms, or pause further exposure.
Review the score when the facts change
The score should move when material facts move. A delayed funding round, management turnover, missed milestone payment, or sudden dispute pattern should trigger a refresh.
If the score is static while the relationship changes, the model has already gone stale.
Validating the Model and Customizing Workflows
A model shouldn't be trusted because it looks polished. It should be trusted because it behaves sensibly when conditions worsen and because it would have caught at least some of the problems you already know about.
Validate the workbook before you rely on it
Start with back-testing. Pull a sample of prior clients and score them as they looked at onboarding, not as you understand them today. Then compare the score against what happened in collections.
You're looking for pattern recognition, not perfection. If known slow payers repeatedly fall into safer bands, the weights need work. If stable accounts are constantly flagged as dangerous, the model is too severe and will create unnecessary friction.
A simple validation routine often includes:
- Historical replay using old financials and original terms
- Exception review on accounts that behaved differently than expected
- Override tracking to see whether manual judgment improved or weakened outcomes
Good validation doesn't ask, “Was the score elegant?” It asks, “Would this have changed a real decision in time to matter?”
Stress test with scenarios
Excel's Data Table feature is useful here because it lets you test how sensitive the score is to one variable at a time. For a services client, I often test revenue pressure, margin compression, or delayed collections from their own customers.
For more advanced work, validation can include 10,000+ Monte Carlo simulation iterations to compute Value-at-Risk at 99.9% confidence, and that approach can outperform static scoring by 25% in tail-risk prediction according to this Vose Software example.
Most mid-market firms won't need that level every day. But the principle is useful. Static snapshots miss downside clustering. Stress tests force the workbook to answer, “What if several bad things happen together?”
Customize the workflow, not just the score
The score matters less than the action it triggers. In practice, I'd wire each risk band to a small operational rule set.
For example:
Trigger in Excel | Workflow response |
|---|---|
Score drops into high-risk band | Finance review before new work is released |
Missed milestone payment | AR starts accelerated follow-up cadence |
Trend deterioration across periods | Terms reviewed at renewal or expansion |
Manual override approved | Approval note logged with owner and reason |
Many Excel models stall at this point. Teams calculate the score, then stop. The spreadsheet needs a corresponding playbook for credit holds, escalation timing, and client communication.
Where manual Excel still works, and where it starts to strain
Excel is strong for design, calibration, and policy discipline. It's weaker when the workflow depends on speed, consistency, and cross-team execution.
Once score changes need to trigger outreach, reminders, term changes, or leadership alerts in real time, a workbook starts to lag. By then, the model is still valuable, but its best use is as the blueprint behind a more automated process.
Beyond Excel The Path to AR Automation
A disciplined spreadsheet is a major improvement over guesswork. It gives finance a repeatable way to assess risk, set terms, and support collections with something better than instinct.
But Excel has a ceiling.
Manual entry takes time. Version control gets messy. Payment behavior updates are delayed. And most importantly, the workbook usually sits apart from the actual collections process. The score exists in one place, while the outreach, invoicing, and follow-up happen somewhere else.
That gap is not small. A persistent disconnect exists between Excel templates and modern automation. Seventy-four percent of finance leaders who rely on spreadsheets report DSO increases due to siloed tools, which is why hybrid Excel-AI models are getting more attention according to this discussion of Excel-based client risk management.
What changes when the model becomes operational
The breakthrough isn't replacing your credit judgment. It's operationalizing it.
When firms move from spreadsheet-only control to accounts receivable automation, a few things improve immediately:
- Data moves faster because the scoring logic can pull from the accounting system instead of waiting for manual updates
- Collections become consistent because risk flags can trigger predefined outreach paths
- Term enforcement improves because finance doesn't have to remember every exception manually
- Cash flow visibility gets sharper because scoring and receivables activity are no longer separated
That's the natural next step for firms exploring AI AR automation, QuickBooks AR automation, and broader accounts receivable automation.
Excel remains the foundation
This doesn't mean the workbook was wasted effort. Quite the opposite.
A well-built credit risk analysis excel template teaches the firm what matters. It clarifies inputs, formulas, policy thresholds, and escalation rules. That is exactly the logic an automated system needs.
If you want a broader view of where this is going, this perspective on digital transformation in financial underwriting is a useful complement to day-to-day AR operations. It connects the same core idea: better decisions happen when judgment, data, and workflow stop living in separate systems.
For firms feeling the strain of manual follow-up, this is also the right moment to understand how accounts receivables automation changes execution. The value isn't just speed. It's control.
The spreadsheet is the discipline. Automation is the scale.
Resolut automates AR for professional services in a way that keeps that discipline intact. It helps teams apply consistent credit logic, orchestrate follow-up accurately, and improve cash flow without turning collections into a blunt instrument. If you're ready to move beyond manual spreadsheets, Resolut is a practical next step: consistent, accurate, and human.