
Performance Benchmarking for AR and Collections
Learn performance benchmarking for AR and collections with a step-by-step framework for finance leaders. Reduce DSO and improve cash flow with proven KPIs.
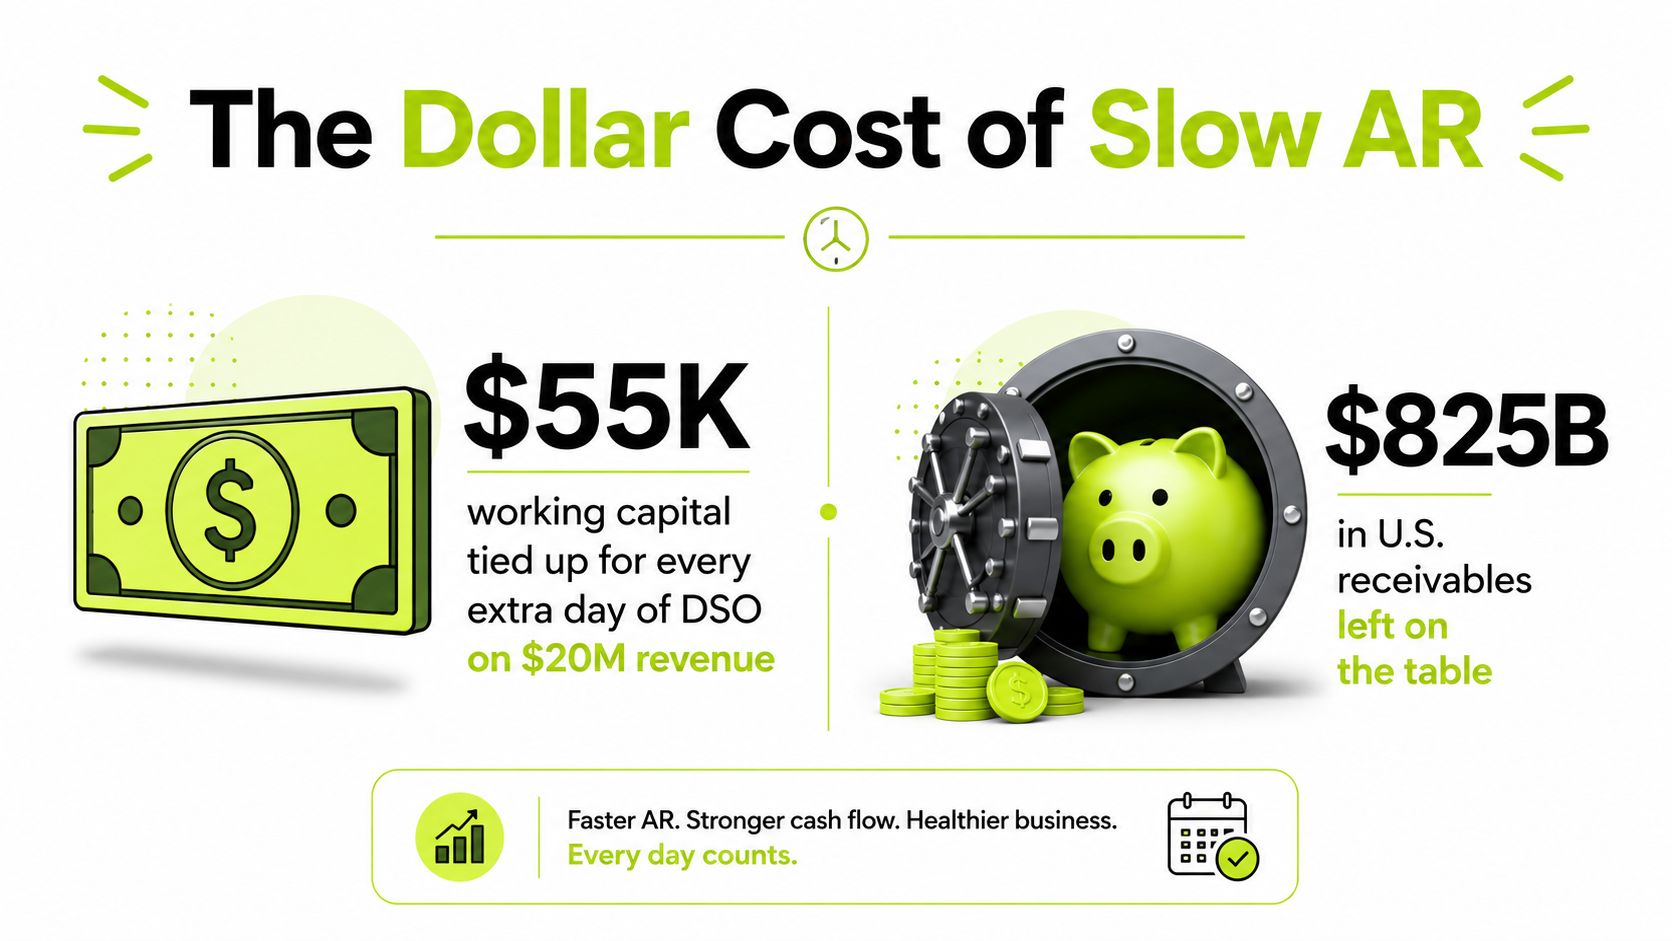
An extra day of DSO on $20 million in annual revenue ties up roughly $55,000 in working capital, while U.S. businesses leave an estimated $825 billion in receivables outstanding at any given time. Those figures are often presented as a reason to buy automation, but the more useful lesson is operational: finance leaders need a reliable way to see where collection performance is drifting, why it's drifting, and which intervention should happen next.
For a professional services firm with $3 million to $50 million in revenue, performance benchmarking turns accounts receivable from a month-end report into a management system. It connects invoice quality, client behavior, collector activity, disputes, promises, and cash outcomes. The point isn't to chase a universal number. It's to establish a fair baseline, detect variance early, and assign a response that someone owns.
Why Performance Benchmarking Matters in AR Right Now
The common assumption is that an aging report is enough. It isn't. An aging report tells you what's overdue at a point in time, but it won't explain whether the problem came from late invoicing, weak follow-up, disputed milestones, incorrect client contacts, or customers who repeatedly break payment promises.
A controller who reviews aging only at month-end may discover a billing error in week eleven rather than week two. By then, the firm may have extended more credit, delivered more work, and allowed a preventable collection issue to become a client relationship problem.
Practical rule: A benchmark is useful only when it changes what a named person does before the next reporting cycle.
The cost of inaction is visible in trapped working capital. The hidden cost comes from managing by instinct. One collector may spend an hour chasing a familiar but low-risk account, while another ignores a newer customer whose payment behavior has deteriorated. Both can look busy. Neither is allocating effort from evidence.
A workable performance benchmarking program prevents three recurring failures:
- Unmanaged drift: DSO, dispute duration, and promise behavior worsen gradually, but no threshold triggers action.
- Misallocated collector effort: Staff work the largest balances instead of the accounts with the highest combination of value, risk, and recoverability.
- Brochure-based targets: Leaders adopt targets from software vendors or generic industry tables without adjusting for billing cadence, customer concentration, or project complexity.
The benchmark should therefore sit between finance judgment and operational detail. It needs enough consistency to reveal movement, but enough segmentation to avoid punishing a team for serving a client mix that behaves differently from the supposed peer group.
The KPIs Every Finance Leader Should Track
A useful AR scorecard has four KPI families. Each answers a different management question, and none should be interpreted alone.
Cash velocity
DSO measures average collection time:
(accounts receivable balance ÷ credit sales for the period) × days in the period)
The formula measures the average days between invoicing and payment collection, not merely the number of days since an invoice was issued, as explained in this guide to Days Sales Outstanding.
For project-based professional services firms, a planning band of 35 to 45 days can be a useful internal starting point, but it isn't a universal standard. Professional services DSO commonly falls within a broader 35 to 65 day range, with billing cadence and client mix driving meaningful differences across consulting, accounting, legal, marketing, and design firms (industry DSO benchmarks).
Track DSO adjusted for unbilled revenue as well. A firm can show acceptable billed DSO while holding substantial work in progress that hasn't been invoiced. The adjusted view should incorporate unbilled receivables into the exposure and make the billing delay visible.
The cash conversion cycle adds operating context:
days inventory outstanding + DSO − days payable outstanding
For a services firm with little or no inventory, the useful comparison is usually the relationship between collection days and payment terms. A longer cycle demands more working capital, even when reported profitability looks healthy.
Collection effectiveness
CEI measures the share of collectible receivables collected during a period:
(beginning receivables + credit sales − ending total receivables) ÷ (beginning receivables + credit sales − ending current receivables) × 100
A stretched internal goal may be above 80%, but inspect the aging distribution underneath it. CEI can look strong while the 90-day bucket continues to expand if current invoices are collected efficiently and older balances are written down or excluded.
Track the share of receivables at 30, 60, 90, and 120 days past due. The direction matters more than a single month's position. A growing 60-day bucket often points to a process issue that hasn't yet become a severe credit problem.
For a broader dashboard design, this board-ready KPIs guide is useful when deciding how to present definitions, owners, targets, and variance commentary. Finance teams can also use this AR KPI reference when standardizing the metric dictionary.
Promise behavior
The promise-to-pay rate is:
promises received ÷ collection contacts
The promise-to-pay kept rate is:
promises paid on time ÷ promises due
Average slip days measures the average delay after the promised payment date. These metrics distinguish polite conversation from actual cash behavior. A high promise rate with a low kept rate means the collector is obtaining verbal agreement without securing a reliable commitment.
Operational efficiency
Right-party contact rate is:
contacts with the responsible payer ÷ total contact attempts
Dispute cycle time is:
dispute resolution date − dispute opened date
Invoice deduction rate is:
deducted invoice value ÷ invoiced value
These measures show whether the team can reach the right person, resolve blockers, and prevent revenue leakage. A low DSO can hide aggressive write-downs, and a good CEI can mask weak dispute handling. The scorecard should force those tensions into view.
Choosing the Right Peer and Comparative Baselines
A single industry benchmark is usually too blunt for AR management. A $10 million consulting firm and a $200 million staffing firm may share a classification code, but their invoice timing, payment terms, labor economics, and client concentration can be entirely different.
Start with internal history. Ideally, use 6 to 12 months of trailing data and segment it before calculating the baseline. At minimum, separate business units, invoice size bands, billing cadence, and client type.
Monthly retainers should sit apart from milestone invoices. Time-and-materials work should be separated from fixed-fee projects. Enterprise clients, SMB clients, and government customers should have their own views when their approval processes and payment patterns differ.
The baseline should also distinguish controllable delay from contractual delay. If a government client pays on a documented schedule, that isn't equivalent to an enterprise account delaying payment because the invoice lacks a purchase order. Both affect DSO, but only one may indicate a preventable process failure.
A peer benchmark is a comparison point, not a verdict on your finance team.
External data becomes more useful after internal segmentation. Sources such as the Hackett Group, REL, and anonymized peer reports from an ERP provider can help test whether your results are plausible. Filter those comparisons by revenue band, billing model, customer profile, and collection terms wherever the source allows it.
The average DSO by industry resource can help frame an initial comparison, but the firm's own trend line should remain the primary management reference.
Baseline Source | Best Use | Limitation to Watch |
|---|---|---|
Internal trailing history | Detecting drift and measuring process changes | Past performance may preserve old billing weaknesses |
Segmented business-unit history | Comparing similar services and client groups | Requires consistent coding across teams |
ERP peer reports | Testing whether internal results are unusual | Anonymized peer definitions may be unclear |
Hackett Group or REL benchmarks | Executive context and operating-model comparison | Published cohorts may not match your revenue or billing model |
Industry ranges | Sanity-checking an extreme result | A range isn't a target and can ignore concentration risk |
Three comparisons routinely mislead finance leaders. Project milestones get compared with SaaS subscriptions, median benchmarks are treated as representative despite a concentrated customer base, and a published range becomes a target even when the firm's own trend is improving for sound operational reasons.
Instrumenting Data Collection and Building Dashboards
AR data rarely arrives from an ERP ready for serious benchmarking. Before building charts, map every invoice, payment, credit memo, and dispute event to a consistent open date and close date. Use a stable customer ID and invoice ID so that a credit memo doesn't appear to be a new collection event or split one dispute across several records.
Cash posting should be reconciled to bank feeds weekly. Lock the period after close, document corrections, and preserve the original event history. A benchmark that changes every time someone edits an old invoice won't earn trust in a CFO review.
Store a denormalized AR fact table with the aging bucket as a stored column, not only as a calculated view. That makes historical analysis more stable and lets finance compare the bucket assigned at reporting time with later outcomes.
The Monday command page
The CFO dashboard should fit on one command page. Include the DSO trendline, current CEI versus target, the ten most overdue accounts, dispute aging, and the promise-to-pay calendar for the next 14 days. If a chart doesn't help a finance leader decide where to intervene, remove it.
Standardize the refresh for Monday morning. Require a written variance comment for anything marked red, including the cause, owner, next action, and expected retest date. A short weekly reporting discipline, similar to the approach described in Mara's weekly reporting for product teams, helps teams make commentary part of the operating rhythm rather than a quarter-end scramble.
Dashboard Zone | Metric | Refresh | Owner |
|---|---|---|---|
Cash velocity | DSO and DSO adjusted for unbilled | Monday morning | Controller |
Collection effectiveness | CEI versus target | Monday morning | AR manager |
Concentration risk | Ten most overdue accounts | Daily, summarized Monday | Collections lead |
Dispute control | Open disputes by age and reason | Daily | Billing manager |
Promise calendar | Promises due in the next 14 days | Daily | Collector |
Data quality | Unapplied cash and unmatched transactions | Weekly | Cash application owner |
The AR KPI dashboard framework can help teams organize these measures, but the dashboard still needs local definitions. Decide whether DSO uses gross or net receivables, how disputed balances are treated, and when a promise counts as kept.
Running Trend, Cohort, and Root Cause Analyses
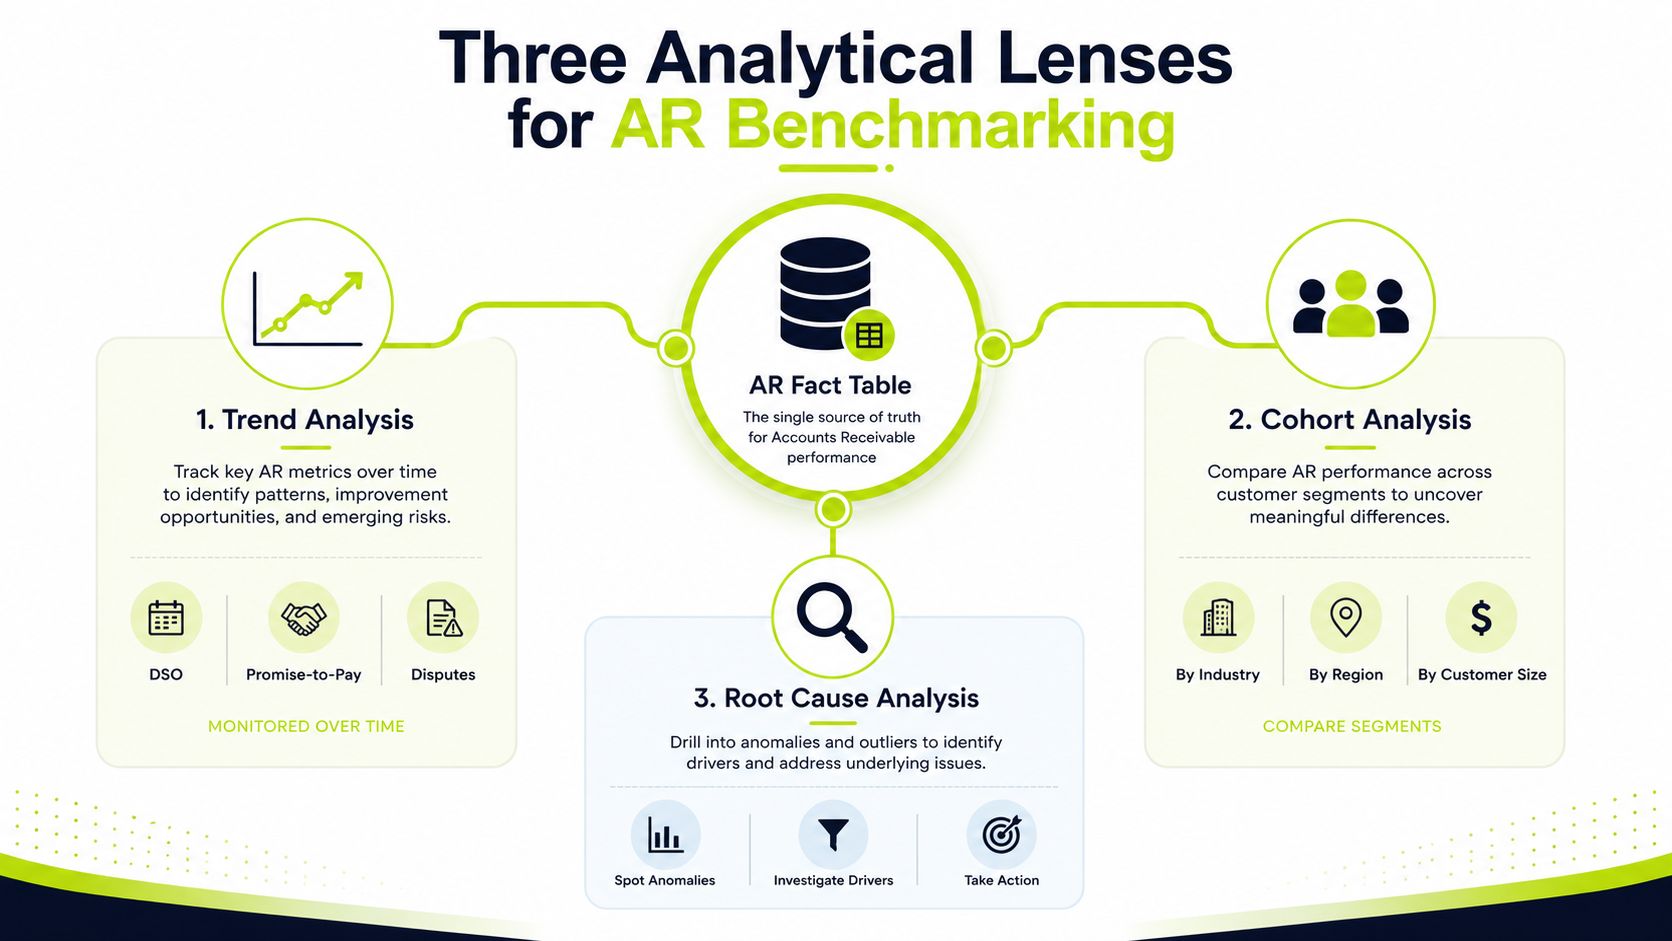
Benchmarking earns its keep when it changes behavior. The same AR fact table can support three analytical lenses, each answering a different question.
Trend analysis
Track DSO, promise-to-pay conversion, and dispute cycle time over a rolling 13 months. The extended view separates seasonality from a genuine process change. If DSO improves while dispute time worsens, the firm may be collecting clean invoices faster while allowing exceptions to accumulate.
Cohort analysis
Group invoices by month issued, customer segment, service line, or sales representative. Then observe how each cohort performs at 30, 60, and 90 days. This reveals whether a new billing process improved collection speed or moved slow-paying accounts into another reporting period.
Root-cause analysis
Cluster disputes, partial payments, and broken promises into a small number of actionable categories. Common examples include missing purchase orders, incorrect rates, milestone acceptance delays, and client-side approval gaps. The value comes from connecting the reason code to the owner who can change the process.
Consider a monthly aging report where DSO has risen, the 60-day bucket is expanding, and total disputes appear stable. Trend analysis identifies when the change began. Cohort analysis shows that invoices from one new service line are aging more slowly than retainer invoices. Root-cause analysis then reveals that many of those invoices lack the client's required milestone documentation.
Each lens prevents a different mistake. Trend analysis prevents overreacting to one month. Cohort analysis prevents averaging unlike invoices together. Root-cause analysis prevents the team from treating symptoms with more reminders.
A short visual walkthrough can reinforce the distinction between these lenses:
The corrective action should follow the evidence. Change the invoice package for the affected service line, assign documentation ownership to billing, and retest the next comparable cohort. More collector activity won't fix an invoice that fails the client's approval requirements.
Setting Targets, SLAs, and a Collections Operating Cadence
Targets without operating mechanics are wishes. Set DSO and CEI targets by cohort, not as one company-wide number, then attach each target to an SLA that a manager can inspect and enforce.
For a professional services firm, practical thresholds might include an 85% contact rate on accounts 15 days past due within five business days, 60% promise-to-pay conversion on the first call, and a 45-day maximum dispute cycle. These are operating thresholds, not universal benchmarks. Your internal data should determine whether they're realistic and where they need adjustment.
Turn each target into a workflow
A target becomes useful when it specifies the action, owner, and escalation path. For example, a missed promise should create a same-day review, not wait for the next monthly meeting. A dispute approaching its maximum cycle should move to the billing manager, then to the account executive when client intervention is required.
KPI | Target Threshold | SLA Timing | Owner | Escalation |
|---|---|---|---|---|
Right-party contact rate | 85% | Within 5 business days of reaching 15 days past due | Collections lead | AR manager, then account owner |
First-call promise conversion | 60% | During initial live contact | Collector | Collections lead |
Dispute cycle time | 45 days maximum | Review weekly until closed | Billing manager | Finance director and service owner |
Top-account review | Top 20 accounts | Weekly 1:1 | AR manager and CFO | Executive sponsor for unresolved risk |
KPI variance | Within 10% of plan | Monthly review | Controller | Documented variance memo |
The top 20 accounts deserve a weekly one-to-one review because concentration can make an aggregate KPI look safer than the underlying exposure. Review balance, age, next action, client relationship owner, promise status, and escalation decision.
A monthly AR review should include a documented variance memo for any KPI more than 10% off plan. The memo should answer four questions:
- What moved?
- Which segment caused the movement?
- What action has an owner?
- When will finance retest the result?
Publish a cadence calendar so sales, billing, finance, and collections know what arrives on their desk and when. The calendar should identify re-escalation rules, especially for broken promises, unresolved disputes, and accounts that receive new work while older balances remain unpaid.
The trade-off vendors often skip is relationship friction. More automation can increase contact volume, but poorly timed or generic outreach can frustrate valuable clients. Set contact rules around client tier, dispute status, and recent human interaction. Automation should enforce consistency while leaving judgment with the person who owns the relationship.
Continuous Benchmarking, Templates, and a Real Firm Example
A monthly benchmarking process has to survive quarter-end pressure. Keep the review to one page with fixed slots: KPI snapshot, peer delta, three root causes, owner, corrective action, and retest date.
The KPI snapshot should show current performance against the internal baseline. The peer delta should identify whether the gap is meaningful after segmentation. The root-cause row should name a process failure, not a vague label such as “client delays.”
Two artifacts worth maintaining
A collections contact script scoring sheet should grade whether the collector reached the right party, confirmed invoice receipt, identified the blocker, secured a dated commitment, and recorded the next action. It's not a call-center script. It's a coaching tool that makes conversations comparable.
A promise-to-pay tracker should include customer, invoice, promised date, amount, contact, confidence flag, and outcome. Use risk flags for repeated slips, partial commitments, disputed invoices, and promises that depend on an unconfirmed approval.
A 250-person consulting firm provides a useful diagnostic example. Its baseline DSO was 58 days, and root-cause analysis showed that 41% of overdue receivables were tied to two clients with non-standard billing. The firm restructured the invoicing cadence, added automated reminders, and reached 41-day DSO in five months.
The important lesson is the diagnostic loop, not the outcome alone. The KPI snapshot identified DSO variance. The root-cause row isolated the two clients and their billing design. The corrective-action row assigned a revised cadence and reminder workflow. The retest date confirmed whether the next invoice cohorts behaved differently.
Metric | Baseline (Month 0) | After 5 Months | Change |
|---|---|---|---|
DSO | 58 days | 41 days | 17-day reduction |
Overdue tied to two non-standard billing clients | 41% | Not reported | Not reported |
Billing cadence | Non-standard for two clients | Restructured | Process change |
Reminders | Added during intervention | Automated reminders in place | Process change |
Keep the template stable from month to month. Changing the definitions whenever the result looks uncomfortable destroys comparability. Change the workflow when the evidence supports it, then let the same benchmark show whether the intervention worked.
Resolut automates AR for professional services with consistent workflows, accurate cash application, and human oversight where client judgment matters. If you're evaluating accounts receivable automation, AI AR automation, or QuickBooks AR automation, visit Resolut to see how it can support performance benchmarking and help your team reduce DSO.