
Days Receivables Outstanding: Formula, Examples and Fixes
Days receivables outstanding shows how long cash stays tied up after credit sales. Calculate it, read it against terms, and cut it.
Month-end is closed, utilization looks healthy, and the bank balance still feels thin. A partner wants to know why a firm that billed roughly a million dollars of work this month cannot fund payroll without drawing the line. The open invoice list is long, a few large bills went out in the last week, and nobody can say, in one sentence, how many days of sales are sitting unpaid.
That sentence is what days receivables outstanding is for. It will not tell you which client is difficult. It will tell you how much of the credit book is cash you do not have yet, and whether that gap is widening.
What Days Receivables Outstanding Tells You
Say a controller at a professional services firm bills about $1 million of work a month, all on credit, and collections arrive at a steady pace. The open balance stays roughly flat. Revenue is not the problem. The problem is how long that revenue waits in accounts receivable before it becomes cash.
Treat receivables as a tank. Each credit sale fills it. Each receipt empties it. Days receivables outstanding, also called days sales outstanding or DSO, measures how many days of sales are sitting in the tank right now. Dashboards, lender packs, and board slides all use those names for the same liquidity metric. The Uncap glossary on days sales outstanding defines it as the average number of days a company waits to collect payment after a credit sale.
The standard annual formula is DSO = (average accounts receivable ÷ net credit sales) × 365. Average accounts receivable is the beginning balance plus the ending balance, divided by two. Net credit sales cover the same period. Average balances matter because a single month-end or year-end spike, one large invoice dated the 30th, can make ending receivables look worse than the month was.
Work the figures. Average receivables of $2 million against $12 million of annual credit sales produce a DSO of about 60.8 days: ($2 million ÷ $12 million) × 365. The firm carries roughly 60.8 days of sales in unpaid customer balances. It does not mean every invoice is paid on day 60.8. Some clients pay in 20 days. One project invoice may sit for 90.

Read the result as a trend and a working-capital signal, set beside contractual terms, prior periods, budgets, and peers that resemble your book. A rising figure can point to slower payment, billing errors, disputes, weak follow-up, or weaker client credit. It can also point to none of those, which is why the rest of this piece separates the cash story from the method risk.
Practical rule: Do not manage to a single DSO print. Manage the gap between that print and the terms you already sold.
A steady line across twelve months, with the tank neither flooding nor running dry, is often a healthier signal than a one-month drop you cannot explain.
How to Calculate Days Receivables Outstanding
Lock the method before you debate the result. A mismatched period flatters or punishes the wrong month, and the figure then gets treated as a collections result when it is only a timing error.
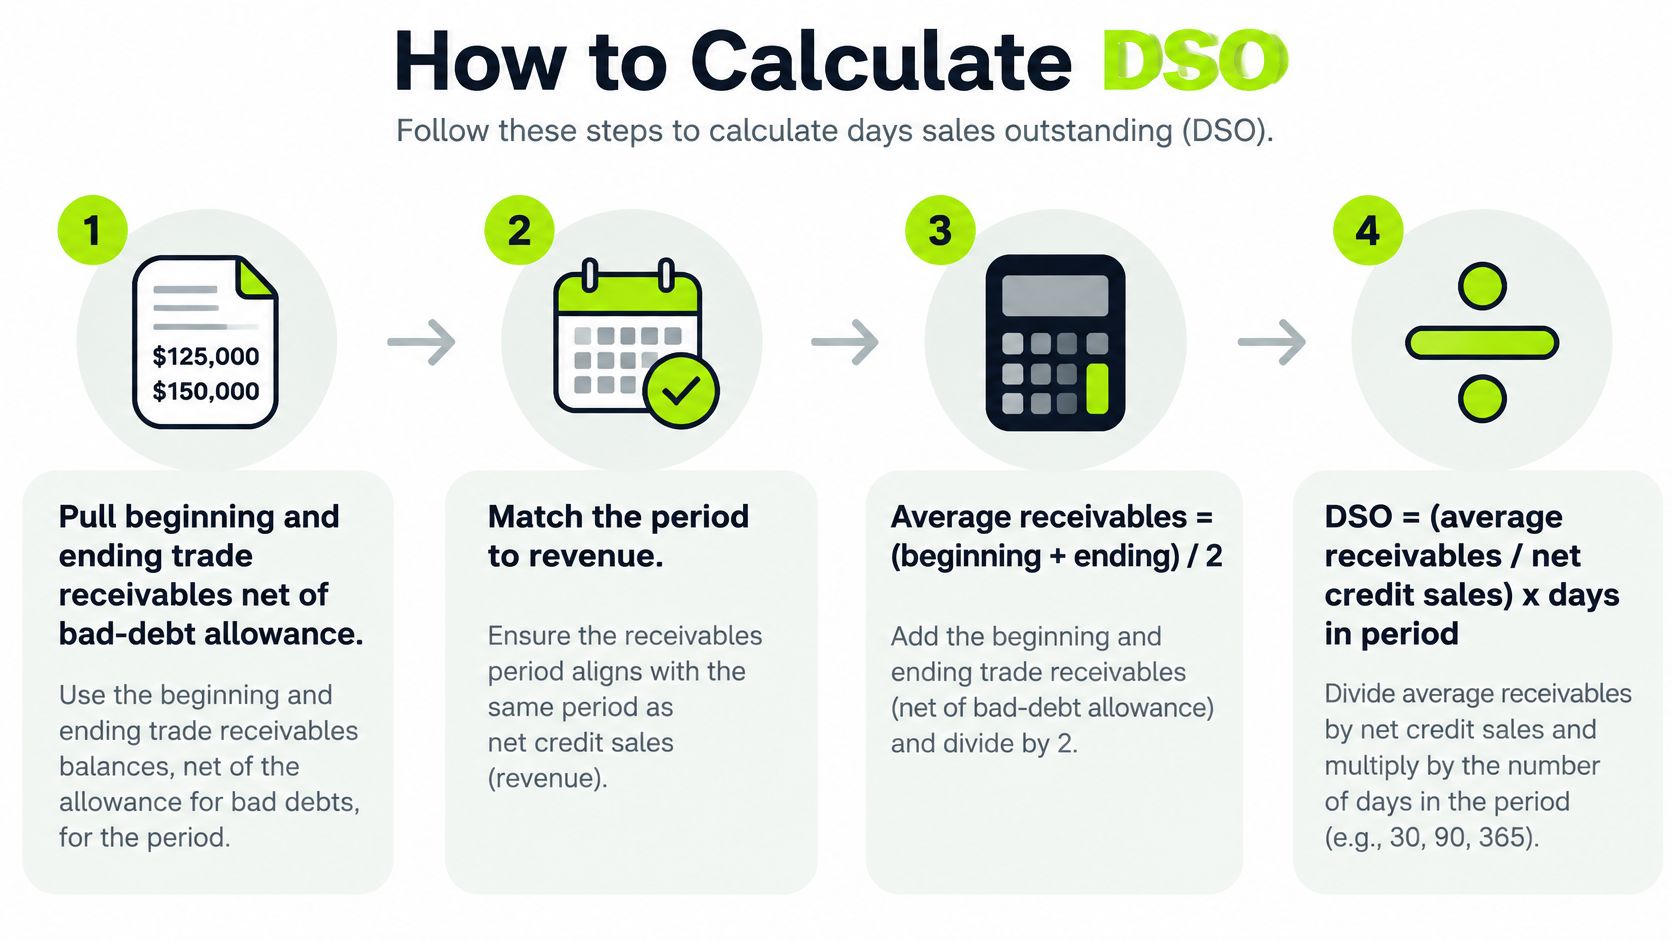
Six steps and the slip in each
- Pull beginning and ending trade receivables for the period, net of the bad-debt allowance, and confirm the dates match the revenue you will use. Mixing a quarterly balance with annual sales produces a number that looks excellent and means nothing.
- Add the two balances and divide by two. One month-end balance in a seasonal billing month, a December project close or a quarter-end push, distorts the tank.
- Take net credit sales for that same period. Leave cash sales out. Use total revenue only if every sale is on credit. Cash left in the denominator understates DSO.
- Divide average receivables by net credit sales. That ratio is the share of the period's credit book still open.
- Multiply by 365, or by the day count of the period you measured. Keep the same basis every month. Switching from 365 to 90 without saying so is a method change, not a collections win.
- Reconcile both inputs to the general ledger before the KPI goes into the pack. Publish the formula beside the number.
If you also report fund-level books, keep those receivables off the operating calculation. A purpose-built platform for CEF finance teams is built for that separation, so a fund receivable does not leak into the firm's trade DSO.
The same credit book, step by step
Use the $12 million credit book so you can check your own sheet against a known result. Beginning trade receivables of $1.5 million and ending trade receivables of $2.5 million average to $2 million. The higher close is in the average; it is not, by itself, proof that collections slowed.
Step | Result |
|---|---|
| $1.5 million and $2.5 million |
| $2 million |
| $12 million |
| 1 to 6 |
| 60.8 days |
Record the formula, the period, the two balances, the sales figure, and the result in the same cell note. Next quarter, a new analyst should be able to reproduce 60.8 days without guessing whether you used gross or net receivables, or whether the day count was 365.
The short walkthrough below follows the same division, which helps when a partner wants to see the arithmetic rather than a dashboard tile.
For a monthly close, I would keep one annual view and one period view, both net of the allowance, both credit sales only. If the two diverge sharply, check whether the balances and the sales cover the same dates before you ask collectors to explain the gap.
Reading DSO Against Your Payment Terms
The benchmark that matters is your own contract, not a universal “good” number. Calculate the weighted-average contractual due date across open invoices, then set actual DSO beside it.
The 15-day gap
Most of a professional services book on net 30 should not print at 45 days. The Chaser account of receivables KPIs uses that exact comparison: net-30 customers at a DSO of 45 days leave a 15-day excess. That excess is cash delayed past what was agreed. Trace it through billing accuracy, disputes, approval bottlenecks, payment-channel friction, and how soon anyone follows up.
A clean definition of the payment term on the invoice is the starting point. If the contract says net 30 and the invoice says “due on receipt,” the gap is yours, not the client's.
Gap versus terms | What it usually signals | First check |
|---|---|---|
At or below terms | Billing and collections keep pace with terms | Confirm the trend holds for three months |
1 to 15 days above terms | Disputes, approval delays or late invoices | Review aged items by dispute status |
More than 15 days above terms | Slow payers or rising credit risk | Rank overdue customers by balance and promised payment date |
Treat those bands as a rough screen, not a standard. A firm that sells net 45 into a few large enterprises will sit higher than a firm that sells net 15 to many small clients. Published US trade-receivables figures put median DSO around 37.5 days, and that is only a directional reference. Industry, customer concentration, and terms move the expected level by more than a few days.
When a falling DSO is not better collections
DSO can improve for the wrong reason. Sales can accelerate, so new invoices dilute the average. Overdue invoices can be written off, so the numerator shrinks without a receipt. Pair the ratio with three companions.
- Aging migration: Watch whether invoices move from current into 30, 60, and 90, or whether they clear.
- Overdue percentage: A stable DSO with a fatter past-due tail is a worse book, not a better one.
- Collection Effectiveness Index (CEI): CEI measures the share of collectible receivables converted to cash, and it is less vulnerable than DSO to a surge in sales volume.
Segment overdue balances by dispute status and by promised-payment date. A disputed milestone and a client who said “Friday” do not deserve the same reminder. Indiscriminate chasing trains good clients to ignore you.
Why DSO Can Move Without Collections Changing
DSO is often sold as a clean score of collector performance. It is not. It is a balance-to-flow ratio, and the flow can change while every client pays exactly as before.
A late-month invoice
Issue a $150,000 invoice on the 28th. Ending receivables jump by that amount the moment it is booked. DSO for the period rises. Every customer who was already invoiced still paid on time. Nothing in the collection process got worse. The tank filled because you billed, not because someone stalled.
The reverse is just as common. Credit sales grow quickly, new invoices dominate the denominator, and DSO stays flat or falls while invoices from six months ago remain unpaid. The headline looks controlled. The tail is not.
Shortening contractual terms, shifting a slice of work to cash at delivery, or moving the billing date from month-end to mid-month can all lower the ratio without speeding payment on invoices that already exist. The National Association of Credit Management white paper on DSO is direct on the limit: DSO is meaningfully comparable only when sales are steady and payment terms are consistent, and it does not show whether receivables are current or overdue.
Did collections worsen, or did the composition and timing of sales change?
Ask that before you put a movement in the board pack. If you cannot answer it, you do not have a collections story yet.
Method changes that look like performance
Three documentation choices create false improvement.
- Allowance: A numerator gross of the bad-debt allowance runs higher than one that is net. Switching mid-year looks like progress.
- Revenue window: Monthly sales, quarterly sales, and trailing twelve-month sales are different denominators. Pick one and label it.
- What sits in the balance: Non-trade items, deposits, and unapplied cash do not belong in trade DSO. Netting unapplied cash makes the ratio look better while the application backlog is still there.
A client who says the invoice is already paid, while your ledger still shows it open, is the same class of distortion. The cash may have landed and the match may not have. Controllers dealing with cross-border “we already paid” disputes can use this payment mismatch guide for Israeli exporters as a checklist for evidence before they treat the balance as late.
For a seasonal firm, a single quarter will lie. Use a rolling twelve-month figure, or a countback that walks backward through recent sales until the receivable balance is used up. Pair the headline with due-date aging, past-due DSO, collection effectiveness, and invoice-level payment latency. Then you are looking at invoices that are late, not at a period-end spike.
What Each Day of DSO Is Worth in Cash
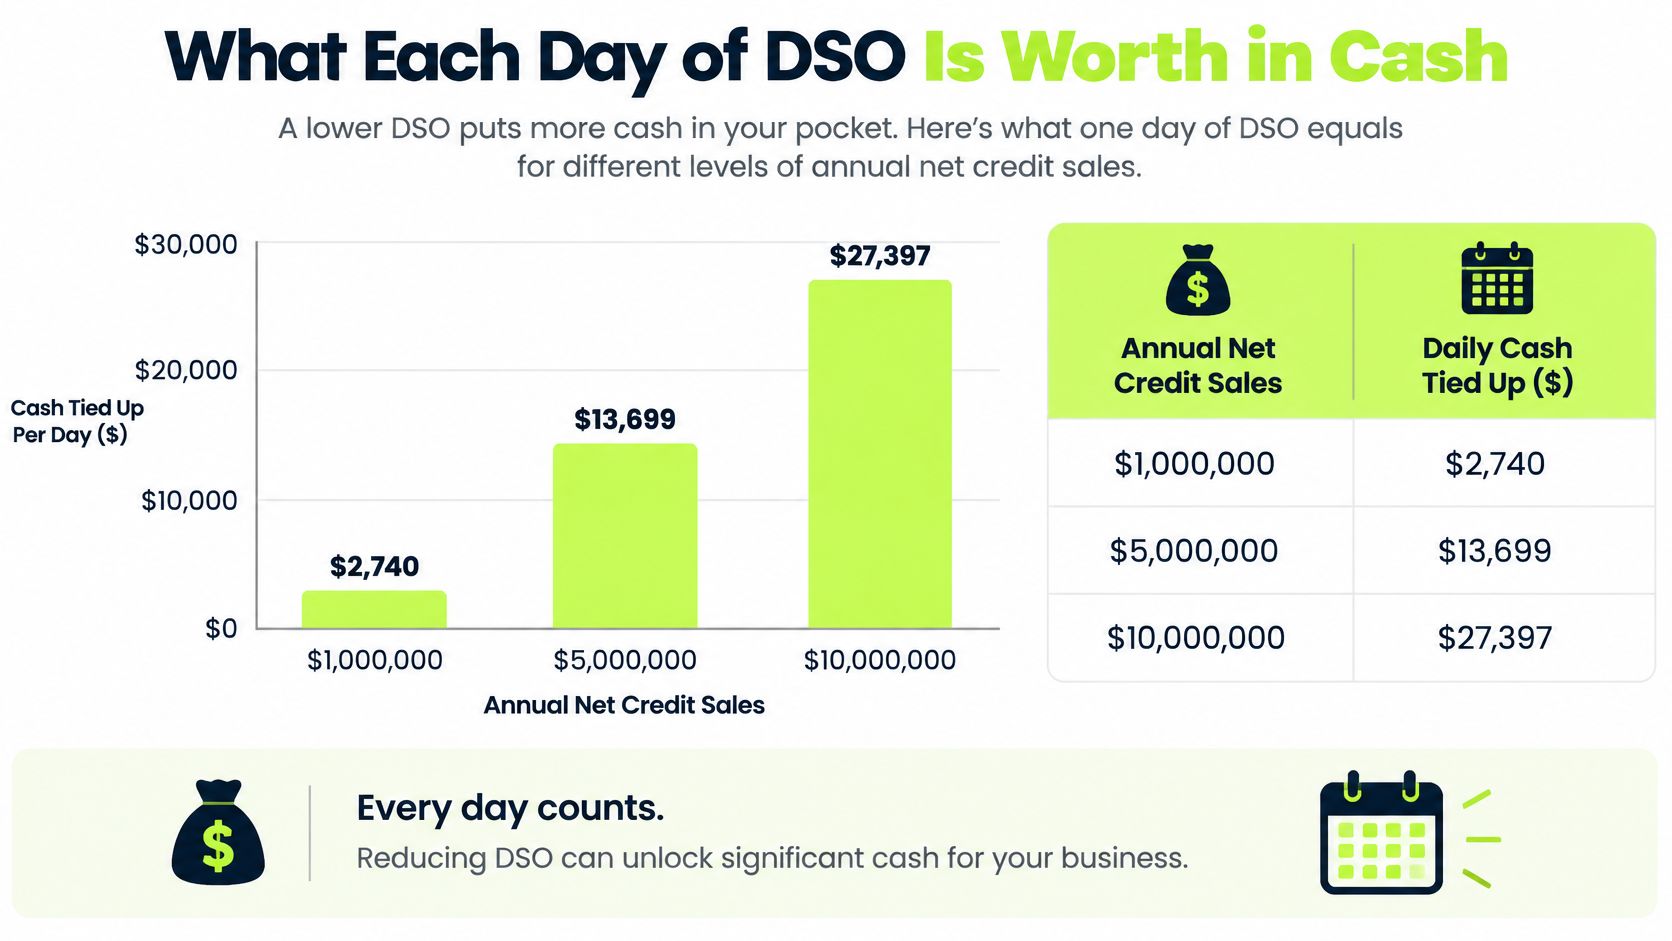
Price the day before you debate the ratio. One day of DSO is one day of average credit sales. Divide annual net credit sales by 365. That dollar amount is the cash tied up, or released, when the ratio moves by a day, before tax and financing effects.
A firm with $100 million of annual credit sales has about $274,000 in one DSO day. The figure is $100 million divided by 365. It is not a cash-release result from a study. The Yale School of Management working-capital paper defines the cash-conversion cycle as CCC = DSO + DIO − DPO. For most professional services firms, inventory days are close to zero, so receivables dominate the operating investment. Cutting DSO and stretching payables both shorten the cycle, and they do not cost the same relationships. The practical map is in how to improve the cash conversion cycle.
Scale it to the firms in this range
Annual net credit sales | Cash released per DSO day |
|---|---|
$3 million | $8,219 |
$10 million | $27,397 |
$25 million | $68,493 |
$50 million | $136,986 |
$100 million | $273,973 |
A $10 million credit book carries about $27,400 per day. Ten days of genuine improvement releases about $274,000, the same cash a $100 million firm releases from a single day. A $50 million book carries about $137,000 a day. At that size, a 10-day gap against terms is well over a million dollars of working capital.
Two exclusions matter. The figure ignores tax, and it ignores financing. If you borrow against receivables, each extra day also costs interest or tightens the borrowing base, so the cash is worth more than the gross release. I would not quote the release until the day came from faster payment. A late-month invoice, a shift in the sales mix, lower billings, unapplied cash parked against the balance, or write-offs can move the ratio without putting that cash in the account.
Put both numbers in the monthly pack: DSO, and the dollar value of one DSO day. Leadership will argue about a disputed invoice differently when the day is priced. Break the consolidated figure by customer, region, contract terms, aging bucket, and invoice cohort. A stable average can hide one slow practice group.
How to Reduce DSO Without Straining Client Relationships
You can reduce DSO and still improve cash flow without turning every partner into a collector. The sequence below starts upstream of the chase. Tightening terms alone shifts the ratio and leaves behavior alone.
An older SEC filing's working-capital disclosure reported accounts-receivable DSO of 73 days, inventory days of 84, payables days of negative 46, and a cash-conversion cycle of 111 days, with DSO defined from net receivables over a 90-day average of net revenue. A move from 73 days to 63 releases roughly ten days of revenue from working capital, and only if the change is faster payment rather than lower billings or aggressive write-offs. Track billed revenue, collections, credits, write-offs, and unapplied cash in the same view, or a prettier DSO will hide leakage.

The order that protects the relationship
- Bill the day the work is done. Put the purchase order number, the agreed terms, and the payment options on the invoice. An invoice that waits for a monthly batch has already donated those days. A missing PO starts a dispute and restarts the clock.
- Give every dispute one owner and a resolution window. Disputed dollars should not sit anonymous inside the total. A partner who can see the open question will clear it faster than a generic reminder.
- Remind before the due date, then follow a set interval after it. The tone stays neutral. The cadence stays predictable. Property managers who reduce late payments with VerticalRent show how a scheduled reminder beats a panicked one. Copy the discipline, not the rent language. A fuller collections strategy belongs with your engagement terms, not in an angry email.
- Make payment easy. Card, bank transfer, and direct debit remove the “we'll mail a check” float. Friction after a correct invoice is still your DSO.
- Review aged items weekly by customer segment and promised-payment date. A chronic 70-day account and a one-off coding error are different work.
- Escalate at 30 days overdue with a defined rule, such as a call from the partner who owns the relationship. Random escalation trains clients to wait for the partner. A known rule does not.
- Hold the leakage accounts next to DSO. If credits and write-offs rose in the same month the ratio fell, you did not collect faster.
What does not work
Blasting every open invoice on Friday does not work. Clients who pay well start ignoring you, and clients in dispute feel accused. Accounts receivable automation helps only when it carries the dispute status and the promised date, so the message matches the balance. AI AR automation that sends the same note to every account will reduce DSO on a slide and damage the book. QuickBooks AR automation and other AR software for professional services should post the invoice, apply the cash, and stop outreach once the invoice is paid. If the tool cannot see a paid stamp, it will chase money you already have.
I would start with the cheapest fix: same-day invoicing and a dispute log. Outreach is step three, not step one.
Set Your DSO Baseline and Review It Monthly
A target with no baseline is a wish. Twelve comparable months, one formula, and a cash value on the gap will tell you whether this month is noise.
The monthly routine
- Pull twelve months of revenue and receivables. Calculate DSO each month on the same net trade basis so the series can be compared.
- Take the latest gap between DSO and contractual terms and multiply it by one day of credit sales. That is the cash at stake, not the day count.
- Name the three customer segments with the largest overdue balances. Use the same dispute and promise-date split you already use in the weekly review.
- Assign an owner and a target to each segment, with one review date. A segment without an owner will still be on next month's list.
- At each monthly close, report DSO beside the cash value of one DSO day. Keep the routine fixed. Escalate any segment whose overdue balance has grown for two months running.
That pack is enough for a CFO, a controller, and a firm owner in the $3 million to $50 million range. You do not need a new metric every quarter. You need the same one, priced in cash, with the mix effects called out.
The follow-up load is where manual chasing breaks. Resolut automates follow-ups, scores which customers will pay late, and forecasts cash. Every customer gets a risk score, and every month gets a cash forecast, so the routine runs on current data instead of a spreadsheet rebuilt after close.
Resolut automates accounts receivable for professional services firms that want a lower days receivables outstanding figure without damaging client relationships. The work stays consistent and accurate, with a human still able to step in when a relationship needs it. If you want that control on your own book, visit Resolut.