
How to Calculate Days in AR: A Practical Guide
Learn how to calculate days in AR with clear formulas, Excel examples, and benchmarks CFOs use to improve cash flow and reduce DSO in 2026.
A client invoice passes net 30, then net 45, while your forecast still assumes the cash will arrive this month. The controller checks the bank balance, asks the AR team for an update, and discovers that several invoices are waiting on approval, a disputed line item, or a payment instruction buried in an email thread.
Days in AR turns that frustration into a timeline. Also called days sales outstanding, or DSO, the metric estimates how long receivables remain outstanding after a credit sale. It gives CFOs, Controllers, and firm owners a practical way to connect the balance sheet to cash collection performance.
For a professional services firm, the number matters because revenue only helps fund payroll, tax payments, and growth after the client pays. A rising metric can point to delayed invoicing, weak follow-up, billing disputes, or deteriorating customer payment behavior. A falling metric can support more reliable cash forecasting.
The calculation is simple. The interpretation is where finance teams create value. You need the right sales base, a matching reporting period, an industry-appropriate benchmark, and an operating process that lets the team act before overdue balances become old AR. The following guide covers the formula, a spreadsheet build, benchmark reading, common distortions, and how accounts receivable automation can turn a periodic report into a live operating signal.
The Number That Puts Time on Your Receivables
A client may move from net 30 to net 45 while the cash forecast still assumes payment this month. Days in AR converts that gap into a measurable timeline by asking: how many days of sales are currently sitting in receivables?
The standard calculation compares the AR balance with credit sales for the same period: Accounts Receivable ÷ Total Credit Sales × Number of Days. A full-year calculation uses 365 days. Shorter reporting windows use the matching period, such as 30 or 90 days, as described in Allianz Trade's accounts receivable days guide.
The ratio gives more context than an AR balance alone. €1,000,000 in receivables could be healthy or concerning depending on the sales volume supporting it. Against €12,000,000 in annual credit sales, the calculation produces about 30.4 days in AR. A controller can then compare that result with payment terms, prior periods, and the firm's operating pattern.
Why controllers watch the trend
One month can be distorted by billing timing, milestone invoices, or a large client invoice. The trend usually supports a better decision. If days in AR rises over several reporting periods, customers may be paying more slowly, invoices may be leaving the business later, or collection work may be starting too late.
Industry and contract structure affect the interpretation. A professional services firm with milestone billing may carry a different normal range from a business with recurring monthly invoices. Payment terms, approval steps, customer concentration, and dispute volume also shape the result. The useful comparison is against the firm's own history and commercial model, not an isolated benchmark.
Days in AR is therefore a leading liquidity signal, not just a reporting line. Revenue can grow while cash pressure increases if receivables expand faster than collections. Payroll and operating expenses leave the bank on schedule, while client payments depend on invoice accuracy, approvals, and follow-up.
Practical rule: Treat days in AR as an operating metric when someone owns the causes behind the movement, not only the calculation.
Review it with the aging report, overdue invoice totals, unapplied cash, dispute status, and customer-level payment behavior. Those views show whether a change reflects a broad slowdown or a small group of accounts.
What the metric can change
A reliable calculation gives finance a common language for cash. Sales leaders can see the effect of loose payment terms. Project managers can connect accurate time capture and prompt approvals with collection speed. AR staff can prioritize accounts by risk and value instead of working through an undifferentiated invoice list.
The practical test is whether the team can identify the cause, assign an owner, and act quickly enough to reduce DSO when the trend worsens. Automation supports that process by keeping invoice status, reminders, disputes, and payment activity visible between reporting cycles.
The Days in AR Formula and Its Two Common Variants
Two formulas appear frequently, and both can be valid when their inputs match the business model and reporting purpose. The first is the conventional DSO calculation used across corporate finance. The second is common in revenue-cycle environments, including medical billing, where teams compare total AR with average daily charges (AMS Solutions' days-in-AR benchmark).
Variant one using credit sales
The standard formula is:
Days in AR = Ending Accounts Receivable ÷ Total Credit Sales × Period Days
Map the inputs as follows:
- Ending AR: The receivables balance at the reporting date.
- Total Credit Sales: Credit revenue generated during the selected period.
- Period Days: The number of calendar days represented by that sales figure.
Some teams use average AR instead of ending AR when the balance fluctuates substantially. That can reduce the influence of an unusually high or low period-end balance, but the policy should remain consistent across reporting periods. Beginning AR and ending AR are still useful spreadsheet inputs because they let you calculate average AR as (Beginning AR + Ending AR) ÷ 2 when that approach fits the reporting policy.
The key control is period alignment. A quarter-end AR balance paired with annual credit sales produces a ratio that doesn't describe the same economic window. Pull the AR balance from the same as-of date and the sales activity from the same period.
For a practical reference on using average balances, see this guide to calculating average accounts receivable.
Variant two using average daily charges
The alternative expresses the denominator as a daily amount:
Average Daily Charges = Total Gross Charges for the Period ÷ Number of Days in the Period
Then:
Days in AR = Total Accounts Receivable ÷ Average Daily Charges
This method is especially common in healthcare and revenue-cycle reporting, while finance and enterprise AR teams more often use AR divided by credit sales. The difference matters because gross charges, net credit sales, billed revenue, and recognized revenue aren't interchangeable (Wall Street Prep's AR days explanation).
QuickBooks may provide the sales and AR reports needed to build the standard calculation, but the exact native report depends on the company file, chart of accounts, and reporting setup. Auditors generally care less about one universal formula than about consistent policy, reconciled inputs, and a defensible explanation for the selected sales base.
When sales mix shifts mid-quarter, the variants can diverge. A firm with large milestone billings, pass-through charges, or non-credit revenue may get a different result depending on whether it uses credit sales or gross charges. Build both in the next spreadsheet example, then document which version management uses.
Worked Example in Excel and Google Sheets
Acme Services wants a Q1 view of collections. Its beginning AR is $480,000, ending AR is $612,000, total credit sales are $1,350,000, total sales are $1,500,000, and the reporting period covers 90 days.
Start with a simple input block in Excel:
Cell | Label | Value |
|---|---|---|
B2 | Beginning AR | $480,000 |
B3 | Ending AR | $612,000 |
B4 | Ending AR for Variant 1 | $612,000 |
B5 | Total Credit Sales | $1,350,000 |
B6 | Credit Sales Base | $1,350,000 |
B7 | Total Sales for Variant 2 | $1,500,000 |
B8 | Period Days | 90 |
The duplicated labels make the formula map visible for review. In a production workbook, you can reference a single input cell instead, but explicit labels help another reviewer trace the calculation.
For Variant 1, enter the ending AR in B4, credit sales in B6, and period days in B8. In the result cell, use:
=B4/B6*B8
The result is 40.8 days. This is the standard credit-sales approach.
For Variant 2, place the corresponding inputs in column C:
Cell | Label | Value |
|---|---|---|
C2 | Beginning AR | $480,000 |
C3 | Ending AR | $612,000 |
C4 | Total AR | $612,000 |
C5 | Total Sales | $1,500,000 |
C8 | Period Days | 90 |
Use:
=C4/(C5/C8)
That produces 40.2 days. The two results are close, but they aren't identical because the sales bases differ.
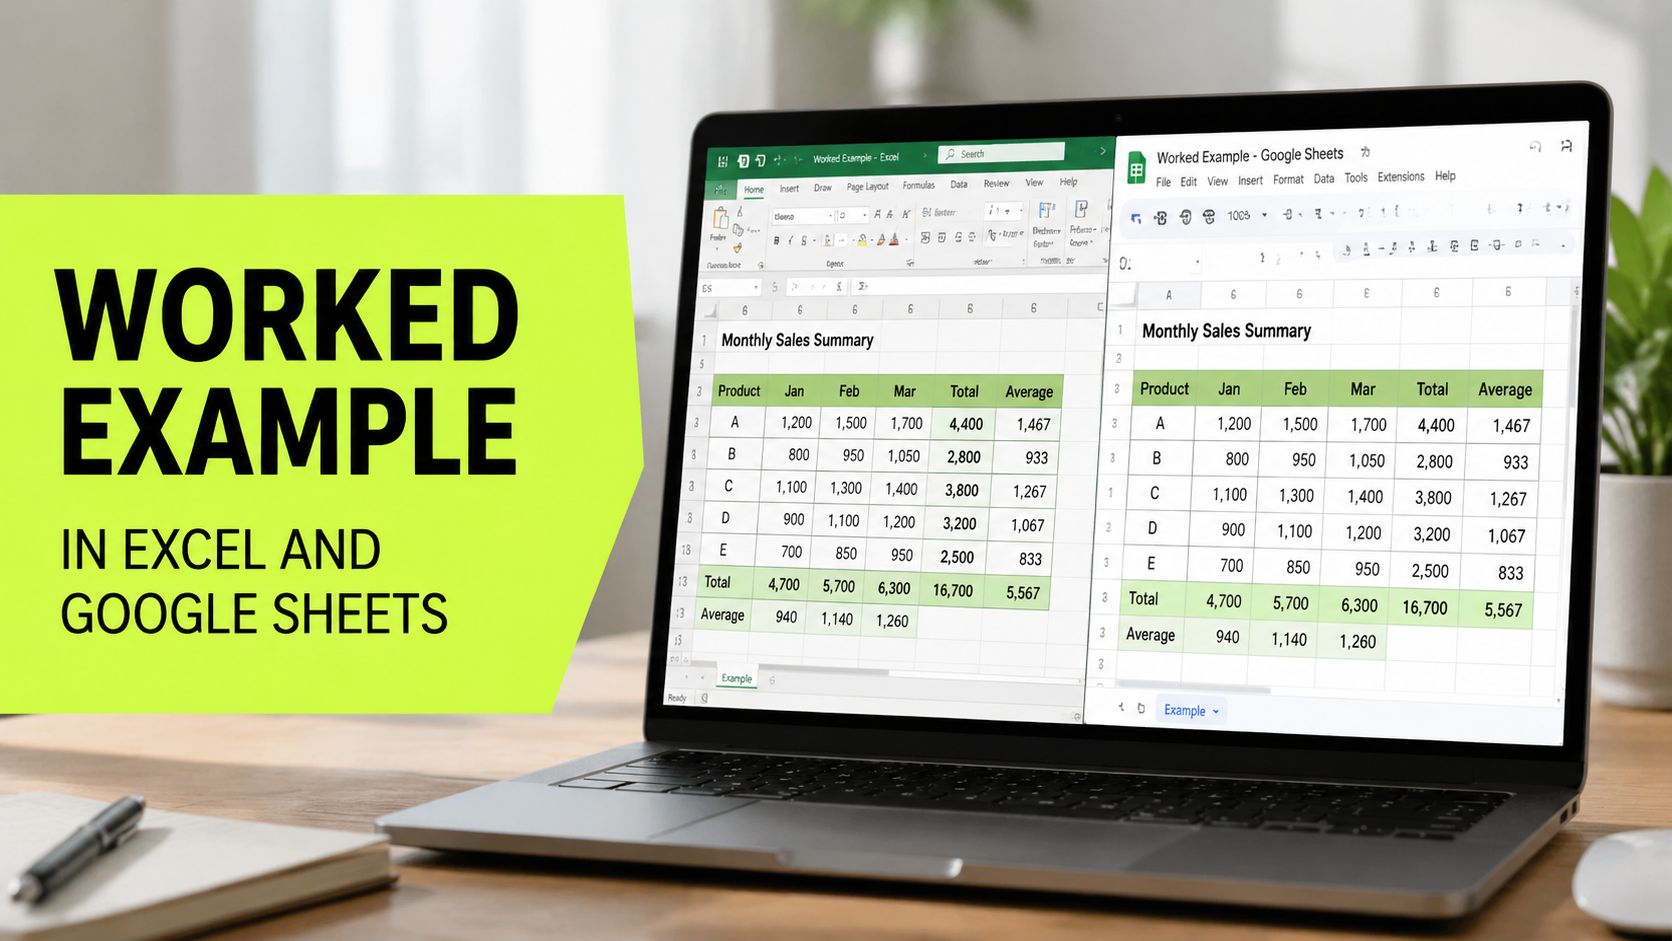
Replicating the build in Google Sheets
Google Sheets uses the same cell references and arithmetic. The formulas above work without modification. Functions such as AVERAGEIFS and array functions also work identically for teams building customer-level or aging-level calculations.
Format the result cells as a number with one decimal place, rather than currency or a percentage. When you reuse the template monthly, lock the period-days cell so the formula always points to the correct reporting input. In Excel, that means using an absolute reference such as $B$8 when appropriate. In Google Sheets, the same dollar-sign convention applies.
Keep a separate reconciliation line for total AR. The ending balance used in the calculation should agree with the trial balance or the approved AR subledger as of the reporting date. For a more detailed invoice-level view, pair the workbook with an accounts receivable aging report template.
Acme's 40.8 days means its ending receivables balance represents roughly forty days of credit sales under the first convention. Whether that is acceptable depends on the firm's contract terms, client mix, and trend.
Interpreting the Result with Real Benchmarks
A days in AR result becomes useful only after you place it against the business that produced it. A professional services firm using milestone billing will have a different collection pattern from a subscription company issuing monthly invoices. Start with your own history, contractual payment terms, and customer mix. Industry benchmarks should sharpen that judgment, not replace it.
As an operating screen, under 30 days indicates strong performance, 30 to 50 days warrants attention, and above 50 days signals a need to investigate. This framework is a starting point, not a universal rule, because billing design and customer payment behavior vary by sector.
A benchmark tells you where to investigate. It doesn't tell you which invoice is causing the problem.
Segment the comparison
Choose peers with a similar revenue model, contract structure, and customer concentration. Comparing a construction contractor with a software company can make a higher result look like weak execution when the underlying billing cycles differ.
Segment | Healthy Range in Days | Concerning Threshold |
|---|---|---|
SaaS | 45 to 70 | Above the company's established range |
Professional services | 60 to 90 | Above the company's established range |
Manufacturing and wholesale | 40 to 55 | Above the company's established range |
Healthcare | 35 to 50 | Above the company's established range |
Construction | 70 to 90+ | Above the company's established range |
These segment ranges provide orientation. Another operational benchmark uses under about 30 to 35 days as strong, 35 to 50 as a watch zone, and above 50 as a warning sign. The difference makes the comparison method important. Confirm the formula, period, and peer population before judging the result.
For broader context, a global benchmark aggregated from more than 75,000 corporate customers reached approximately 59 days in 2023 and 62 days in 2024. The 2024 reading represented a two-day year-over-year increase, according to Chaser's DSO benchmark reporting. A small shift in collection time can tie up substantial working capital. A company with €500 million in annual credit sales would tie up roughly €8.2 million if collections lengthened by six days, using the AR-days relationship described in Chaser's working-capital example.
Review the line monthly and investigate sharp movement before it becomes a quarterly surprise. A rising result should lead to aging analysis, customer-level review, and checks on invoicing and dispute queues. Automation can make that review more useful by refreshing the metric from current ledger and collections data, then directing attention to the accounts driving the change. For a sector-specific comparison framework, use average DSO by industry.
Common Pitfalls That Distort the Number
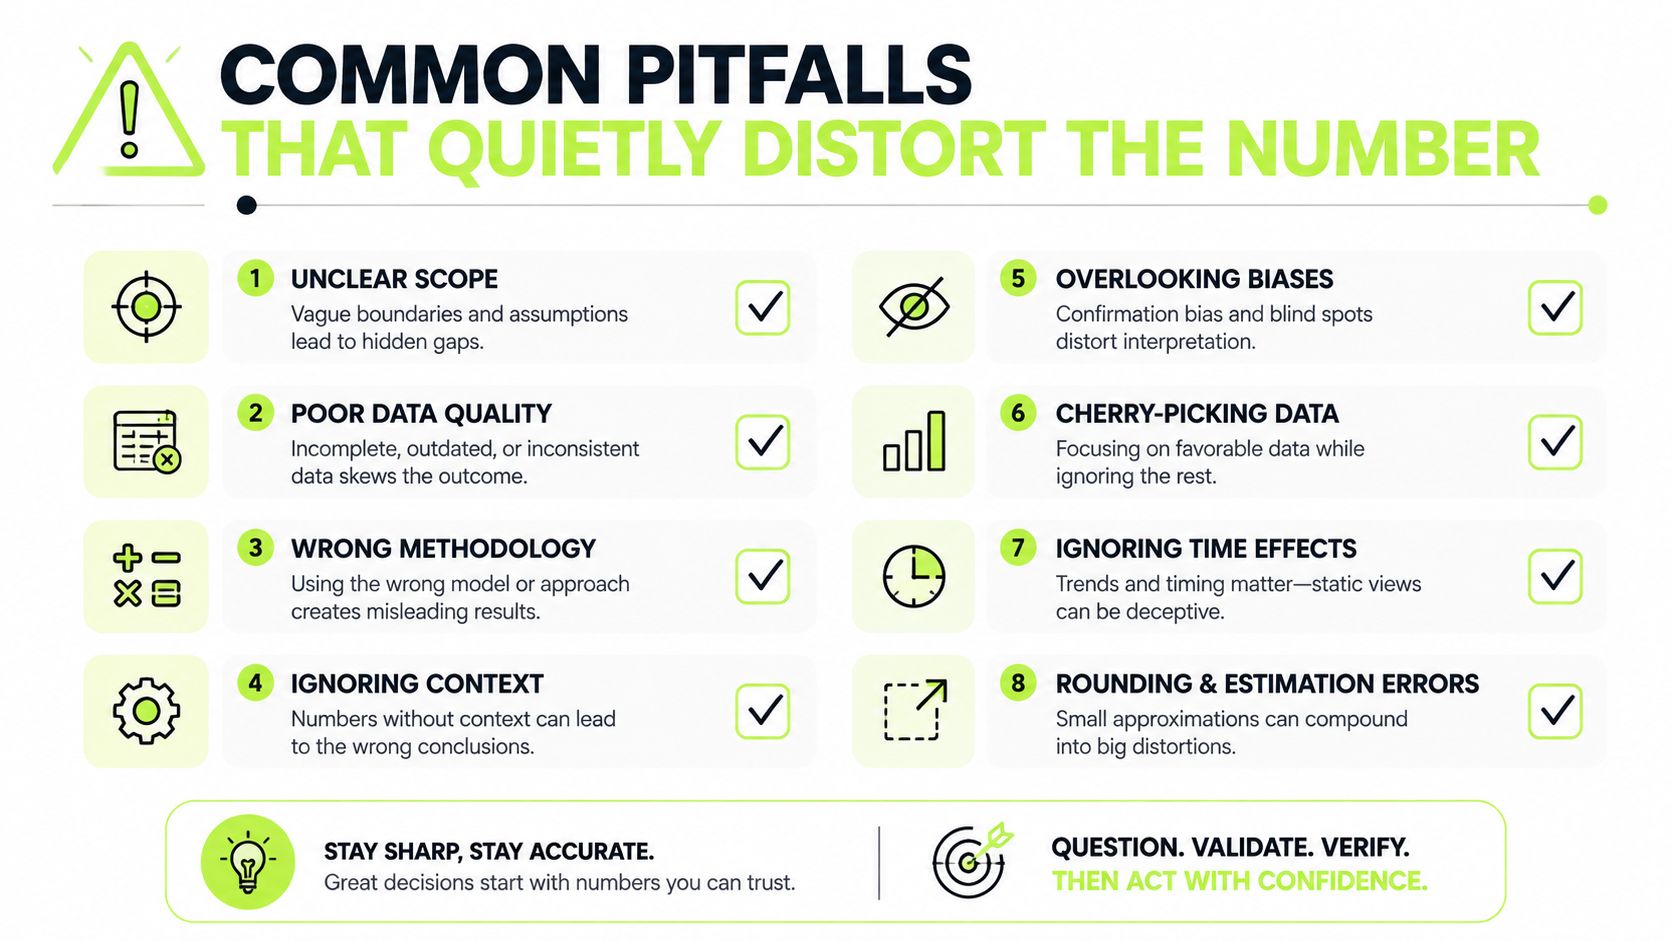
A clean formula can still produce a misleading DSO. The usual cause is a mismatch between the receivables balance, sales period, customer mix, or reporting window.
The numerator and denominator do not match
Pairing a quarter-end AR balance with annual sales, or comparing monthly sales with a balance from several months later, can materially inflate or reduce the result. The numerator and denominator must describe the same operating period.
Corrective move: Use the same as-of date for AR and the same sales period for the denominator. If the calculation uses 90 days, the sales activity and period-days assumption must cover that window. Document whether the numerator is ending AR or average AR.
One average hides difficult accounts
A company-wide figure may improve while a major customer segment continues to age. It also may not show whether the issue comes from a few large invoices, one partner, or a recurring billing process.
Use aging buckets and customer segments. Sort open invoices as of the reporting date, group receivables with similar risk characteristics, assign collection or loss rates by bucket using historical experience adjusted for current conditions, multiply each balance by its rate, and add the results to set an allowance or collection target. The aging-method workflow for AR follow-up provides a practical structure for that review.
Sector comparisons create false alarms
Days in AR means different things across professional services, healthcare, construction, SaaS, and wholesale. Contract milestones, payer rules, customer approval steps, and credit terms all affect the collection cycle.
Corrective move: Compare similar businesses and billing models. Then break the result down by customer, service line, invoice type, and aging bucket. A result that looks weak against a broad market may be normal for a business with milestone billing, while a sector-level average can hide a serious problem in one customer group.
A single trailing period masks seasonality
A short period may capture a billing spike or a slow collection week. Looking only at the latest month can make a seasonal pattern appear to be a process failure.
Corrective move: Add a rolling average that fits the business, such as a rolling 90-day or 180-day view. Keep the raw monthly result visible so the team can separate trend from smoothing.
Controller handoff checklist
- Match the period: Confirm that the AR date, sales window, and day count align.
- Reconcile the balance: Tie ending AR to the approved subledger and GL.
- Define the sales base: State whether the denominator uses credit sales, net sales, or gross charges.
- Segment the result: Review customers, aging buckets, and invoice categories.
- Watch the trend: Keep monthly values beside the rolling average.
- Assign action: Give each material overdue balance an owner and next step.
From Static Metric to Live Signal with AR Automation
A monthly days-in-AR report can show that cash is slow. An automated AR process shows why. It identifies invoices that have not moved, customers approaching overdue status, and disputes likely to delay payment.
A firm operating around 55 days should not pressure every customer in the same way. The better objective is to remove avoidable delay through scheduled invoice delivery, clear payment instructions, reminders, cash application, and early dispute handling. Resolut, Versapay, and YayPay can support these workflows, but finance still needs documented policies and human review for sensitive accounts.

What automation changes operationally
A useful workflow starts before an invoice becomes overdue:
- Invoice delivery: Send invoices promptly to the correct approver, with purchase-order details, payment instructions, and supporting documents.
- Reminder timing: Schedule notices before and after the due date, then escalate based on customer history and invoice risk.
- Dispute routing: Direct billing questions to the responsible project or finance owner instead of leaving them in a general AR inbox.
- Cash application: Match incoming payments to open invoices so the ledger reflects the current position quickly.
- Customer payment options: Give clients accessible invoice records and practical payment methods through a portal.
Payment plans can help recover stalled accounts when a customer has a genuine timing constraint. Credit-limit enforcement limits further exposure while existing balances remain unresolved. Together, these controls connect collections with credit policy instead of treating AR as isolated follow-up emails.
Review these practical invoice automation tips for process choices upstream of collection. The operational test is simple: does the workflow reduce handoffs and make the next action clear to its owner?
A 10-day DSO reduction on $10 million in annual revenue frees roughly $270,000 in working capital, based on the relationship between annual sales, receivables, and collection time, as noted earlier. The same movement can have different operational meaning by industry. A professional services firm may need cash available for payroll and growth commitments, while milestone billing or customer approval steps can make a longer cycle partly structural.
The right AR software for professional services should retain client context while handling repetitive work. For firms using QuickBooks, QuickBooks AR automation should connect invoices, customer records, payment status, and cash application, without making the controller maintain a separate spreadsheet as the system of record. AI AR automation can prioritize at-risk invoices and tailor outreach, while approval controls, audit trails, and human oversight remain necessary for disputes and sensitive client relationships.
Teams that automate AR can reduce days in AR by aligning invoice delivery, reminder scheduling, dispute handling, and cash application in one workflow. Choose tools that fit the existing finance stack, make ownership visible, and keep people involved where judgment affects the customer relationship. That is how a reported ratio becomes an operating signal rather than another month-end number.