
What Is a Good Accounts Receivable Turnover?
What is a good accounts receivable turnover for professional services firms? Learn the formula, industry benchmarks, and how to improve yours.
It's late in the quarter. The aging report is open, the bank balance isn't where you expected it to be, and a partner or owner wants a simple answer: what is a good accounts receivable turnover?
The uncomfortable answer is that a ratio can look healthy while important clients are paying late. It can also look modest because your contracts deliberately use milestone billing or longer terms. For a professional services firm, “good” means faster, predictable cash conversion relative to your own terms, customer mix, and operating history.
The Question Every Finance Leader Asks at Quarter End
A controller sees the same pattern repeatedly. The income statement shows strong billings, utilization is solid, and revenue is on plan. Yet cash feels tight because several large invoices are sitting in approval, a client is disputing time entries, and another account has moved from paying on time to paying whenever its own cash position allows.
Someone asks for the accounts receivable turnover ratio. They want a number that settles the discussion.
The number helps, but it doesn't settle the discussion by itself. A professional services firm billing on Net 30 terms should interpret turnover differently from a firm using milestone invoices, retainage, client acceptance clauses, or longer arrangements for strategically important accounts.
The practical answer: a good turnover ratio is one that improves against your own comparable history, fits your contractual terms, and doesn't hide deterioration in important customer segments.
Start with three comparisons:
- Your own trend: Is turnover improving over a consistent measurement period?
- Your terms: Are clients paying by the agreed due date, or merely within an average that includes late accounts?
- Your peer group: Does the result make sense for professional services and your particular billing model?
That framing matters because a higher ratio can result from tighter credit policies that also reduce sales. A lower ratio can reflect deliberate commercial terms rather than poor collections. Neither conclusion is safe without looking at DSO, aging, disputes, and bad-debt expense alongside turnover.
For CFOs, Controllers, and firm owners managing a professional services business, the useful target isn't maximum turnover. It's reliable conversion of billed work into cash while protecting commercially valuable relationships. That's the standard to use when deciding whether accounts receivable automation or a process change is justified.
The Formula and What the Ratio Measures
A quarter-end review often starts with two balances: annual credit sales and the average receivables tied to them. The standard calculation is:
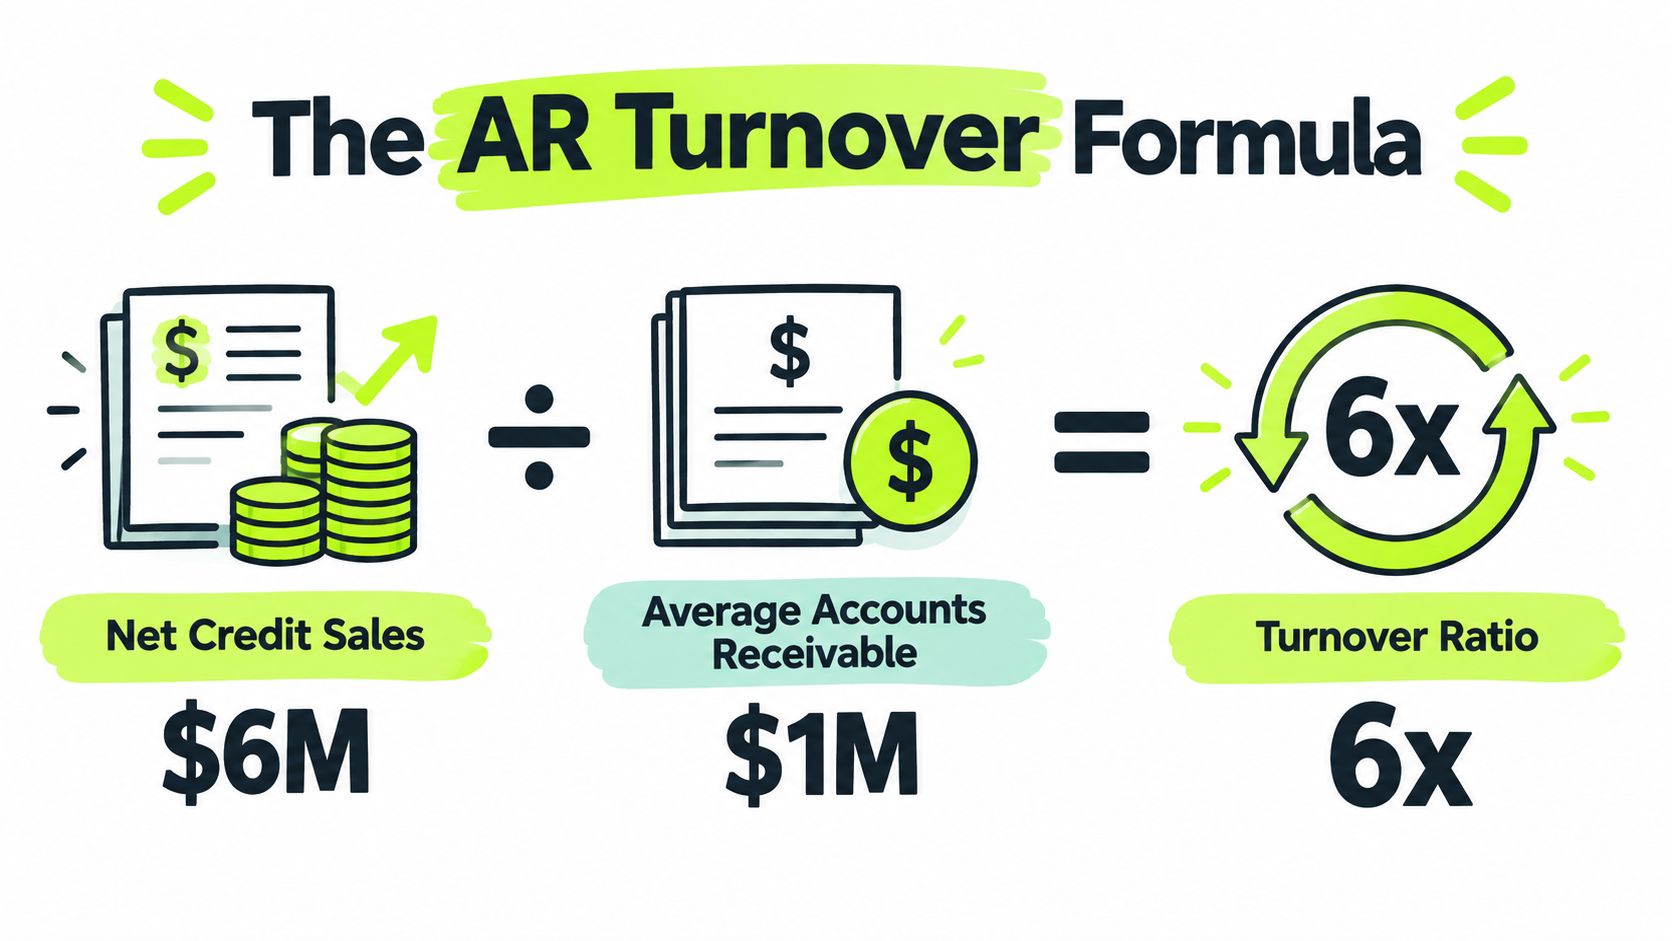
AR turnover = annual net credit sales ÷ average accounts receivable
Average receivables usually equal beginning accounts receivable plus ending accounts receivable, divided by two. The result estimates how many times the average receivables balance was collected during the period, typically one year. See this accounts receivable turnover formula reference for the underlying method.
A clean worked example
Suppose a firm records $6 million in annual net credit sales and carries $1 million in average accounts receivable.
The calculation is:
$6 million ÷ $1 million = 6.0x turnover
The firm collected and replaced its average receivables balance six times during the year. Convert that ratio into an implied collection period for a clearer operating measure:
365 ÷ 6.0 = approximately 61 days
A 6.0x ratio therefore implies that receivables remained outstanding for roughly 61 days on average. Under Net 30 contracts, that gap warrants investigation. With milestone billing, formal client acceptance, or other approval steps, the same result may reflect the commercial process, while still affecting cash planning.
An 8.0x turnover implies collection of the average balance approximately every 46 days, calculated as 365 ÷ 8, using the annualization method shown above.
What movement in the ratio means
A rising ratio generally indicates faster conversion of billed revenue into cash. Possible drivers include stronger follow-up, cleaner invoices, tighter credit controls, or better customer payment behavior.
A declining ratio can indicate overdue invoices, billing disputes, weak reminders, excessive credit, or deteriorating customer credit quality. It can also occur when sales grow faster than collections or when a large invoice remains unpaid at period end.
Turnover identifies movement, not its cause. Validate the calculation and period, then compare the result with aging, due-date performance, and DSO. For recurring billing and collection dynamics, why receivable turnover matters for SaaS provides relevant context, even for service firms.
For reporting based on collection days, use how to calculate DSO and keep the methodology consistent across periods.
Industry Benchmarks That Actually Apply to Professional Services
A turnover ratio becomes useful only after you translate it into days and compare it with a relevant operating model. Professional services firms commonly need more time than a point-of-sale business because invoices may depend on approved time, expenses, milestones, purchase orders, or client procurement processes.
The following ranges are illustrative, not universal targets. They show why a CFO shouldn't compare a consultancy directly with a wholesale distributor and call one result good and the other bad.
Sector | Typical DSO | Implied turnover | Why it sits there |
|---|---|---|---|
Professional services | 35–55 days | 10.4–6.6x | Approved time, expenses, project billing, and client procurement |
Manufacturing | 40–55 days | 9.1–6.6x | Credit sales, purchase-order controls, and customer terms |
Healthcare | 40–60 days | 9.1–6.1x | Payer adjudication, denials, and approval workflows |
Construction | 60–90 days | 6.1–4.1x | Milestones, retainage, inspections, and project acceptance |
Wholesale and distribution | 30–45 days | 12.2–8.1x | Shorter commercial terms, commonly around Net 30 |
The DSO and implied turnover ranges above come from industry DSO benchmarks and their corresponding turnover ranges. The calculation is approximately 365 divided by DSO, so a longer collection period naturally produces fewer annual turns.
Why the comparison set matters
Construction often carries longer cycles because retainage and milestone billing delay payment even when the project is progressing properly. Healthcare receivables may remain open while payers adjudicate claims or resolve denials. Wholesale commonly operates on shorter terms, so its turnover can look stronger without indicating a superior collections operation.
Professional services sits between those models. A firm with straightforward recurring invoices may reasonably aim toward the faster end of its sector range. A firm delivering complex projects with client acceptance gates may need to assess performance against those contractual mechanics instead of chasing a distributor's ratio.
The right question is whether your actual payment behavior matches the economics you priced into the engagement. Compare DSO with contracted terms, aging concentration, dispute-resolution time, promise-to-pay adherence, and bad-debt expense. If turnover improves while delinquent balances expand, the aggregate ratio is giving you incomplete information.
For a more detailed comparison framework, see average DSO by industry. Use benchmarks as a starting point, then set targets by client segment, service line, and billing model.
Why Higher Is Not Always Better
Finance teams often treat a larger turnover ratio as an automatic win. Faster collection usually supports liquidity, but the ratio can improve for the wrong commercial reason.
A firm may tighten credit terms so aggressively that creditworthy clients choose another provider. It may require deposits where the market expects reasonable flexibility. It may decline work from customers with strong margins just because their procurement process takes longer. The balance sheet improves, but revenue growth and client retention suffer.
That's not an efficient cash strategy. It's a transfer of risk from receivables to sales.
A strong ratio should describe healthy cash conversion, not a policy that makes good customers impossible to serve.
The same caution applies when management focuses on easy invoices. Large, reliable clients may pay promptly while smaller accounts, newer customers, or strategically important projects move deeper into delinquency. The average can still look acceptable because the stronger accounts carry more volume.
Payment timing also needs to be separated into agreed terms and actual delay. Global businesses took an average of 51 days to get paid in 2025, made up of 32 days of agreed terms and 19 days of delay, meaning nearly 40% of the B2B payment cycle occurred after contractual due dates, according to reported global payment-cycle data.
That distinction changes the management conversation. A firm on Net 60 may have lower turnover than a firm on Net 30, yet perform better against its promises if customers consistently pay by day 60. Conversely, a Net 30 firm collecting on day 45 may look tolerable in a broad benchmark while carrying an avoidable funding burden.
Evaluate turnover with revenue growth, gross margin, customer retention, DSO, aging, and bad-debt rates. The objective is predictable cash flow without excluding customers who are profitable and worth serving.
Reading Turnover Like an Early Warning System
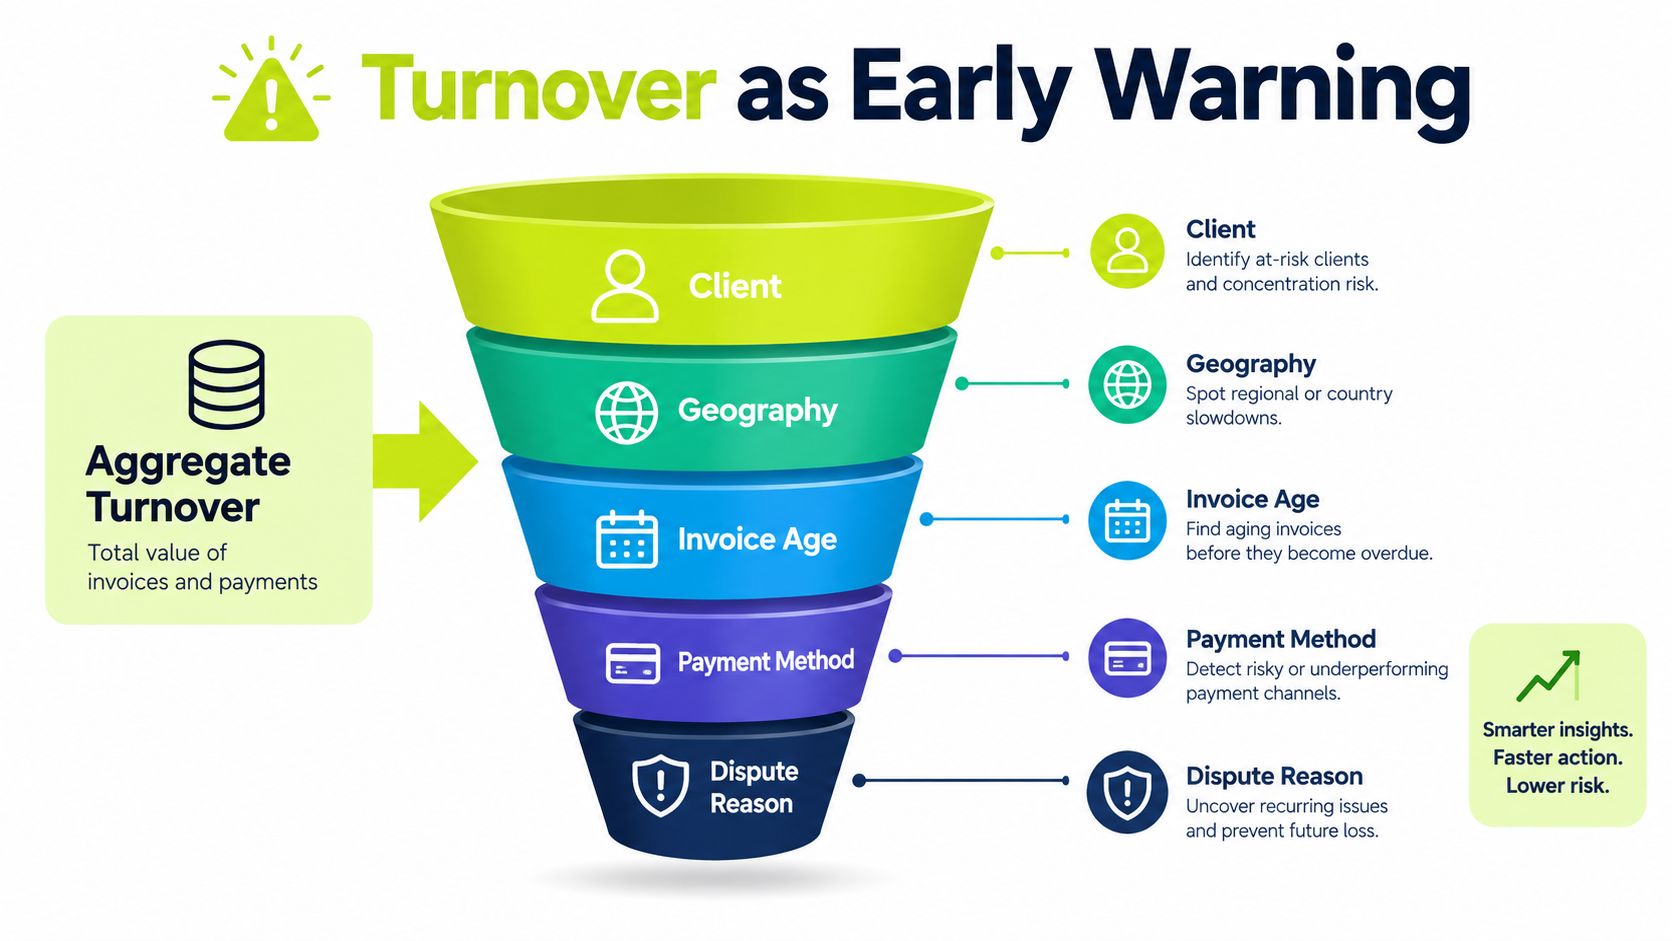
Aggregate turnover is an average. Averages are useful for reporting, but they conceal dispersion.
A professional services firm can have a respectable ratio because a few large clients pay promptly while other accounts accumulate overdue balances. The CFO needs to know where the deterioration sits, not just whether the company-wide average moved.
Start with a repeatable segmentation view:
- Client: Separate major accounts, smaller customers, new engagements, and accounts with prior late-payment behavior.
- Geography: Identify regions where payment practices, tax requirements, or banking processes create longer cycles.
- Invoice age: Compare current, recently due, and seriously overdue balances rather than blending them together.
- Payment method: Look for friction tied to bank transfer, card, portal, or manual payment instructions.
- Dispute reason: Distinguish pricing questions, missing purchase-order data, unapproved time, incomplete documentation, and service-quality concerns.
Measure delay against the promise
The most actionable question is not, “How many days does this customer take to pay?” Ask, “How many days past the agreed due date does this customer pay, and why?”
UK government data found that 54% of businesses with B2B customers used 30 days as their standard payment term, while 36% reported that customers took longer than agreed. Small businesses were more likely to experience that slippage, at 49%, according to the UK government's late-payments research.
For a professional services firm, that means due-date performance should sit in the monthly operating review. Track invoices paid by terms, invoices paid late, average delay after due date, open disputes, and the age of unresolved disputes.
Turn findings into ownership
A dispute without an owner is usually a delayed invoice. Assign responsibility to the person who can resolve the underlying issue, whether that's the project lead, billing team, account manager, or client procurement contact.
Review the segments where delay exceeds terms, then ask whether the remedy belongs in billing setup, contract design, customer communication, or collections. This turns turnover from a retrospective finance ratio into an early-warning tool for revenue operations and client management.
Manual AR Work Versus Automated Workflows
Manual AR often looks inexpensive because the cost is scattered across the team. A billing coordinator checks spreadsheets, a controller reviews the aging report, an account manager sends a reminder, and someone in accounting applies the payment after matching a bank reference.
The process works until volume, customer variety, or staff absence exposes its weak points. Reminders go out late, follow-up depends on individual memory, and a dispute remains open because no one can see its current owner.
Automation changes the operating model rather than just speeding up one task.

Manual operating model | Automated workflow |
|---|---|
Staff check aging reports and decide whom to contact | Rules prioritize accounts by due date, risk, balance, and history |
Reminders depend on individual calendars | Messages run before and after due dates through defined workflows |
Customers receive inconsistent explanations | Templates and account context keep outreach accurate and consistent |
Cash application waits for manual matching | Payments route into a reconciliation workflow for faster posting |
Management sees a periodic snapshot | Dashboards expose movement by customer, segment, and aging |
The choice isn't “people versus software.” Sensitive accounts still need judgment, especially where a relationship manager should call before a formal escalation. The useful design is human oversight around automated timing, data preparation, routing, and routine follow-up.
Terms still drive the economics
A 2025 QuickBooks survey reported that 60% of small businesses using longer payment terms experienced cash-flow problems, compared with 40% among businesses using immediate terms. The survey doesn't establish that payment terms alone caused the problems, but it does show why term design belongs in an AR turnover review. The finding is reported in QuickBooks' small-business late-payments report.
For a firm evaluating what AR automation involves, the relevant test is operational. Can the workflow send accurate reminders on schedule, surface disputes before they age, make payment easy, and give the controller a reliable view of expected cash?
AI AR automation can help prioritize outreach and identify patterns, but it won't repair unclear invoices, weak contract language, or unapproved time records. Automation is effective when it supports a clean process. It's ineffective when it merely sends more messages into an unresolved billing problem.
Practical Steps to Improve Your Ratio This Quarter
Improvement starts with the invoice, not the final collections email. A 90-day plan should assign an owner to each step and measure movement in DSO, due-date adherence, aging, and dispute time.
First, tighten the invoice-to-send window
Review the lag between completed work and invoice delivery. For each service line, identify what must be present before billing can proceed, such as approved time, expense support, a purchase order, or a milestone sign-off.
Set an operating expectation for sending complete invoices promptly. The measurable outcome is a shorter billing lag and fewer invoices that become overdue before the client has received correct documentation.
Second, align billing structure with risk
Use deposits for new or higher-risk clients when the commercial relationship supports them. For longer engagements, use milestone billing tied to documented acceptance rather than waiting until the entire project is complete.
Recurring billing can reduce the size of a single exposure for ongoing work. The controller should then compare customer profitability with payment behavior before changing terms across the whole client base.
Third, automate reminders around the due date
A useful workflow starts before the invoice is late. Send a clear reminder with the invoice, payment options, and contact for questions, then route overdue accounts according to balance, history, and dispute status.
The outcome isn't more email. It's fewer invoices reaching late stages without an acknowledged next action. Track promise-to-pay adherence and the time from dispute creation to resolution.
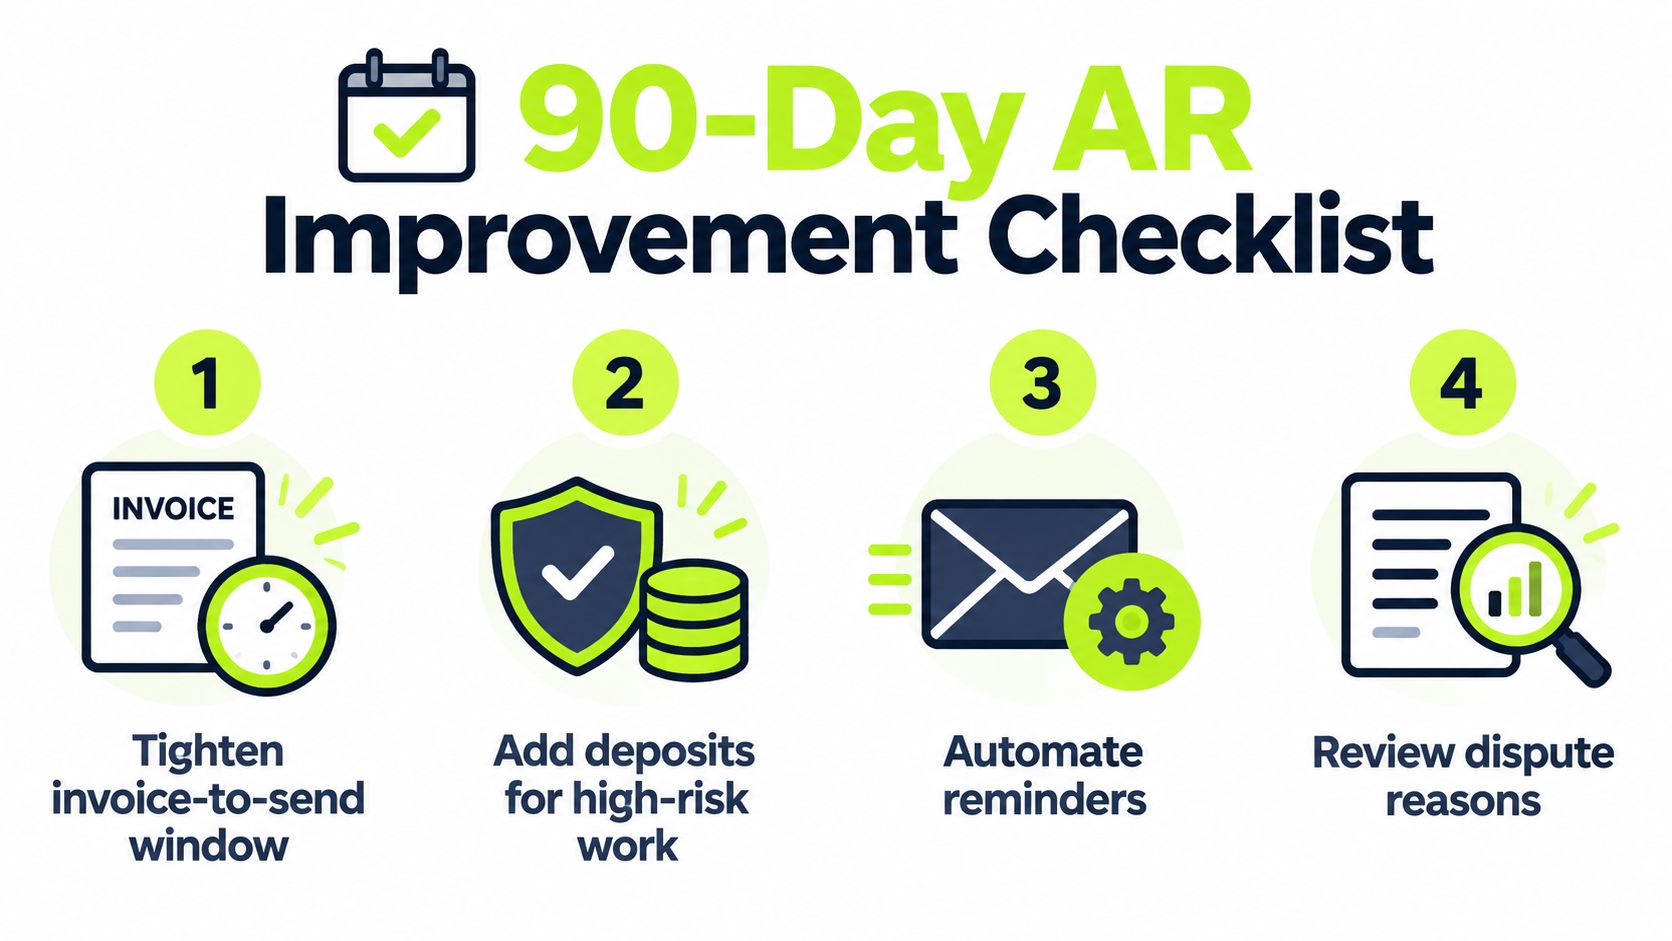
Fourth, review the ratio by segment
A benchmark source places a generally healthy turnover range at 6–12 annual turns, equivalent to collecting average receivables roughly every 30–60 days. Ratios below 6 often signal slow collection or weak billing discipline, while ratios above 12 can sometimes reflect unusually restrictive terms, as outlined in this accounts receivable collections benchmark discussion.
Treat that range as a screening reference, not a target to impose blindly. Review turnover by client, service line, billing model, and aging bucket. Then set a target for sustained improvement alongside lower DSO and stable bad-debt rates.
A controller should be able to answer three questions by the end of the quarter:
- Which accounts are paying beyond agreed terms?
- Which disputes are delaying otherwise collectible invoices?
- Which process change moved cash conversion without harming client relationships?
Bringing It Together and What Good Looks Like Over Time
A good accounts receivable turnover ratio isn't a magic number. It's a result that fits your terms, improves against your own comparable history, and remains healthy when you separate strong payers from problem accounts.
For a professional services firm, the ratio should sit beside DSO, aging concentration, dispute-resolution time, promise-to-pay adherence, bad-debt expense, revenue growth, and customer profitability. Those measures show whether faster collection reflects better execution or stricter commercial decisions.
Return to the quarter-end question. If cash is tight, don't stop at the company-wide ratio. Trace the movement to the customers, invoices, payment methods, and dispute reasons creating the delay. Then decide whether the remedy belongs in contract terms, billing discipline, client communication, collections workflow, or risk management.
The best target is steady, relationship-safe improvement. Your firm should collect more predictably without making valuable clients feel punished for buying complex services.
Resolut automates AR for professional services, bringing consistent workflows, accurate follow-up, and human control to the collection process.
Resolut automates AR for professional services with structured reminders, risk-aware workflows, dispute visibility, and cash application designed to support lower DSO and better cash flow. Review how it can fit your operating model by visiting Resolut.